87 stories
·
2 followers

Designing your own Custom Under Desk Mounting Bracket

1 Share

For the last couple of years I’ve done a yearly My Dream Desk Setup post, where I go into great detail about my home office setup. One way that I’ve kept the desktop so clean is by mounting key peripherals under my desk using custom offset mounting brackets. This post is NOT sponsored in any way, and the company I used didn’t ask me to write a post or promote them in any way. I’m just an exceptionally happy customer.

To date I’ve designed two custom offset mounting brackets: One for my Topping headphone DAC/Amp combo, and another for a 10Gb edge ethernet switch. Both share very similar traits: Heavy duty powder coated cold rolled steel, one inch mounting flange on both sides, and two holes on each flange for screws.

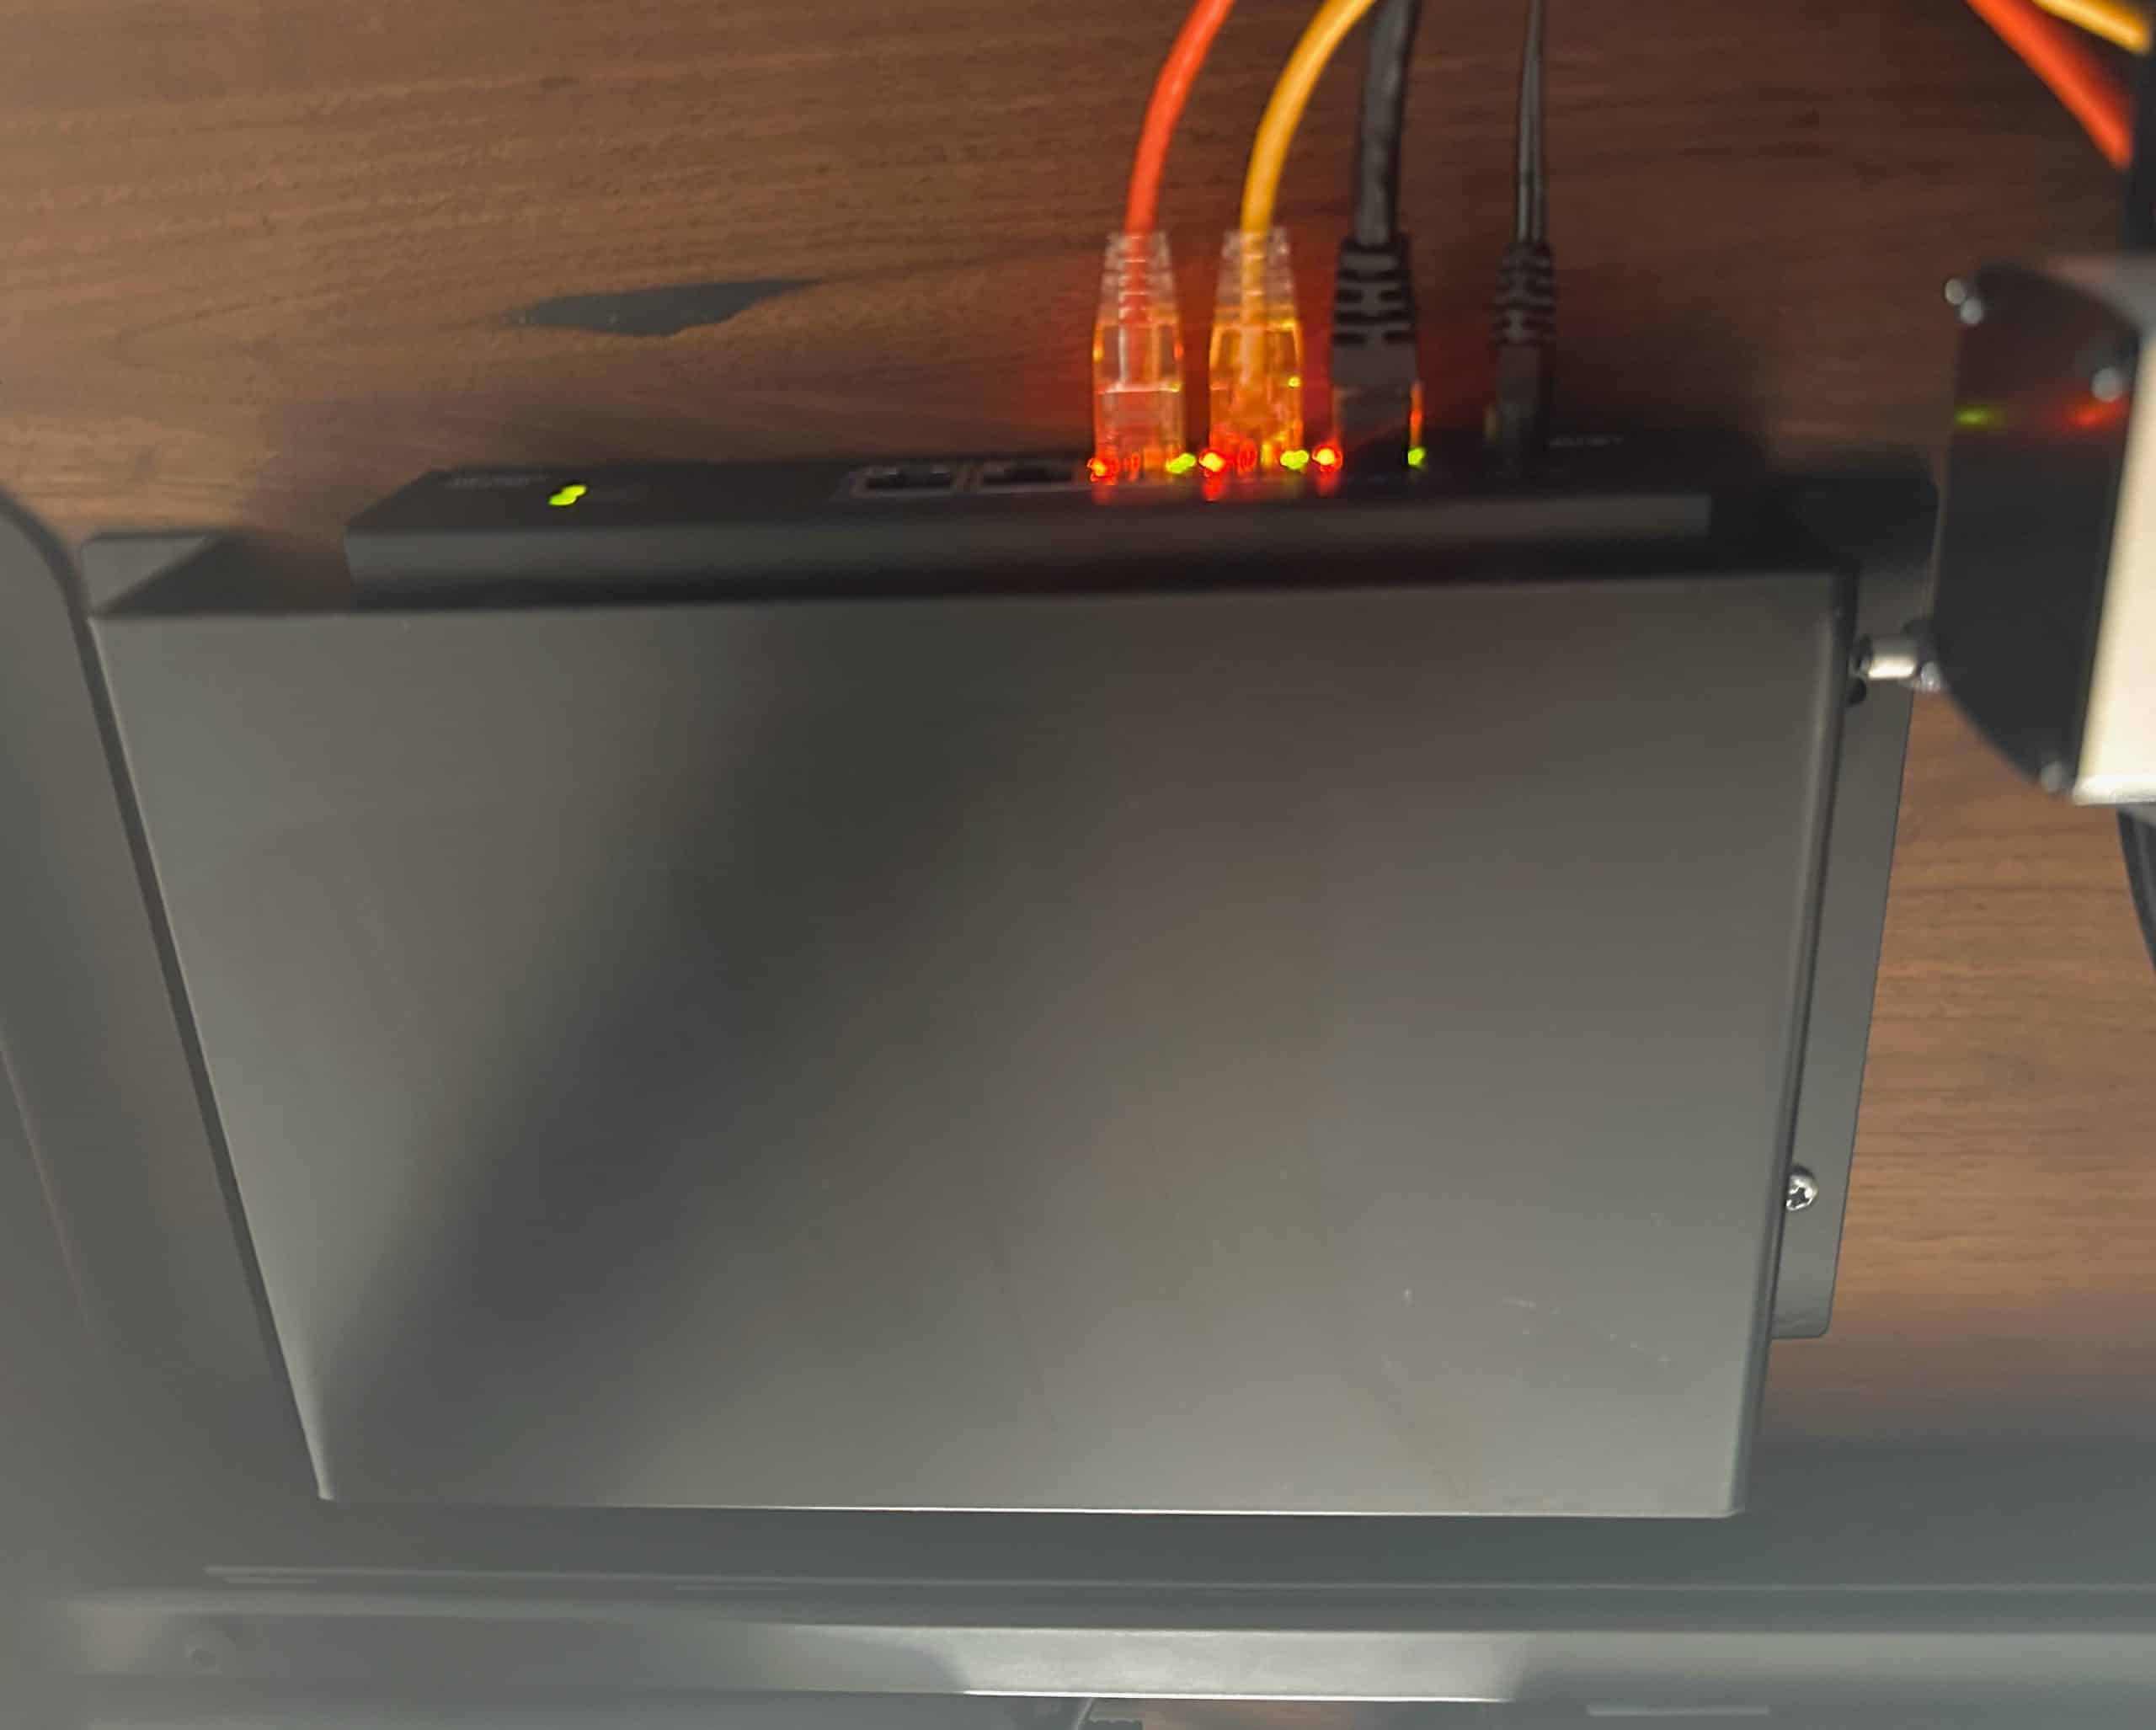
In the first photo below you can see how I’ve mounted the 10Gb TREDnet ethernet switch under my desk. 

TRENDnet 10G Switch and Protocase Custom Mounting Bracket

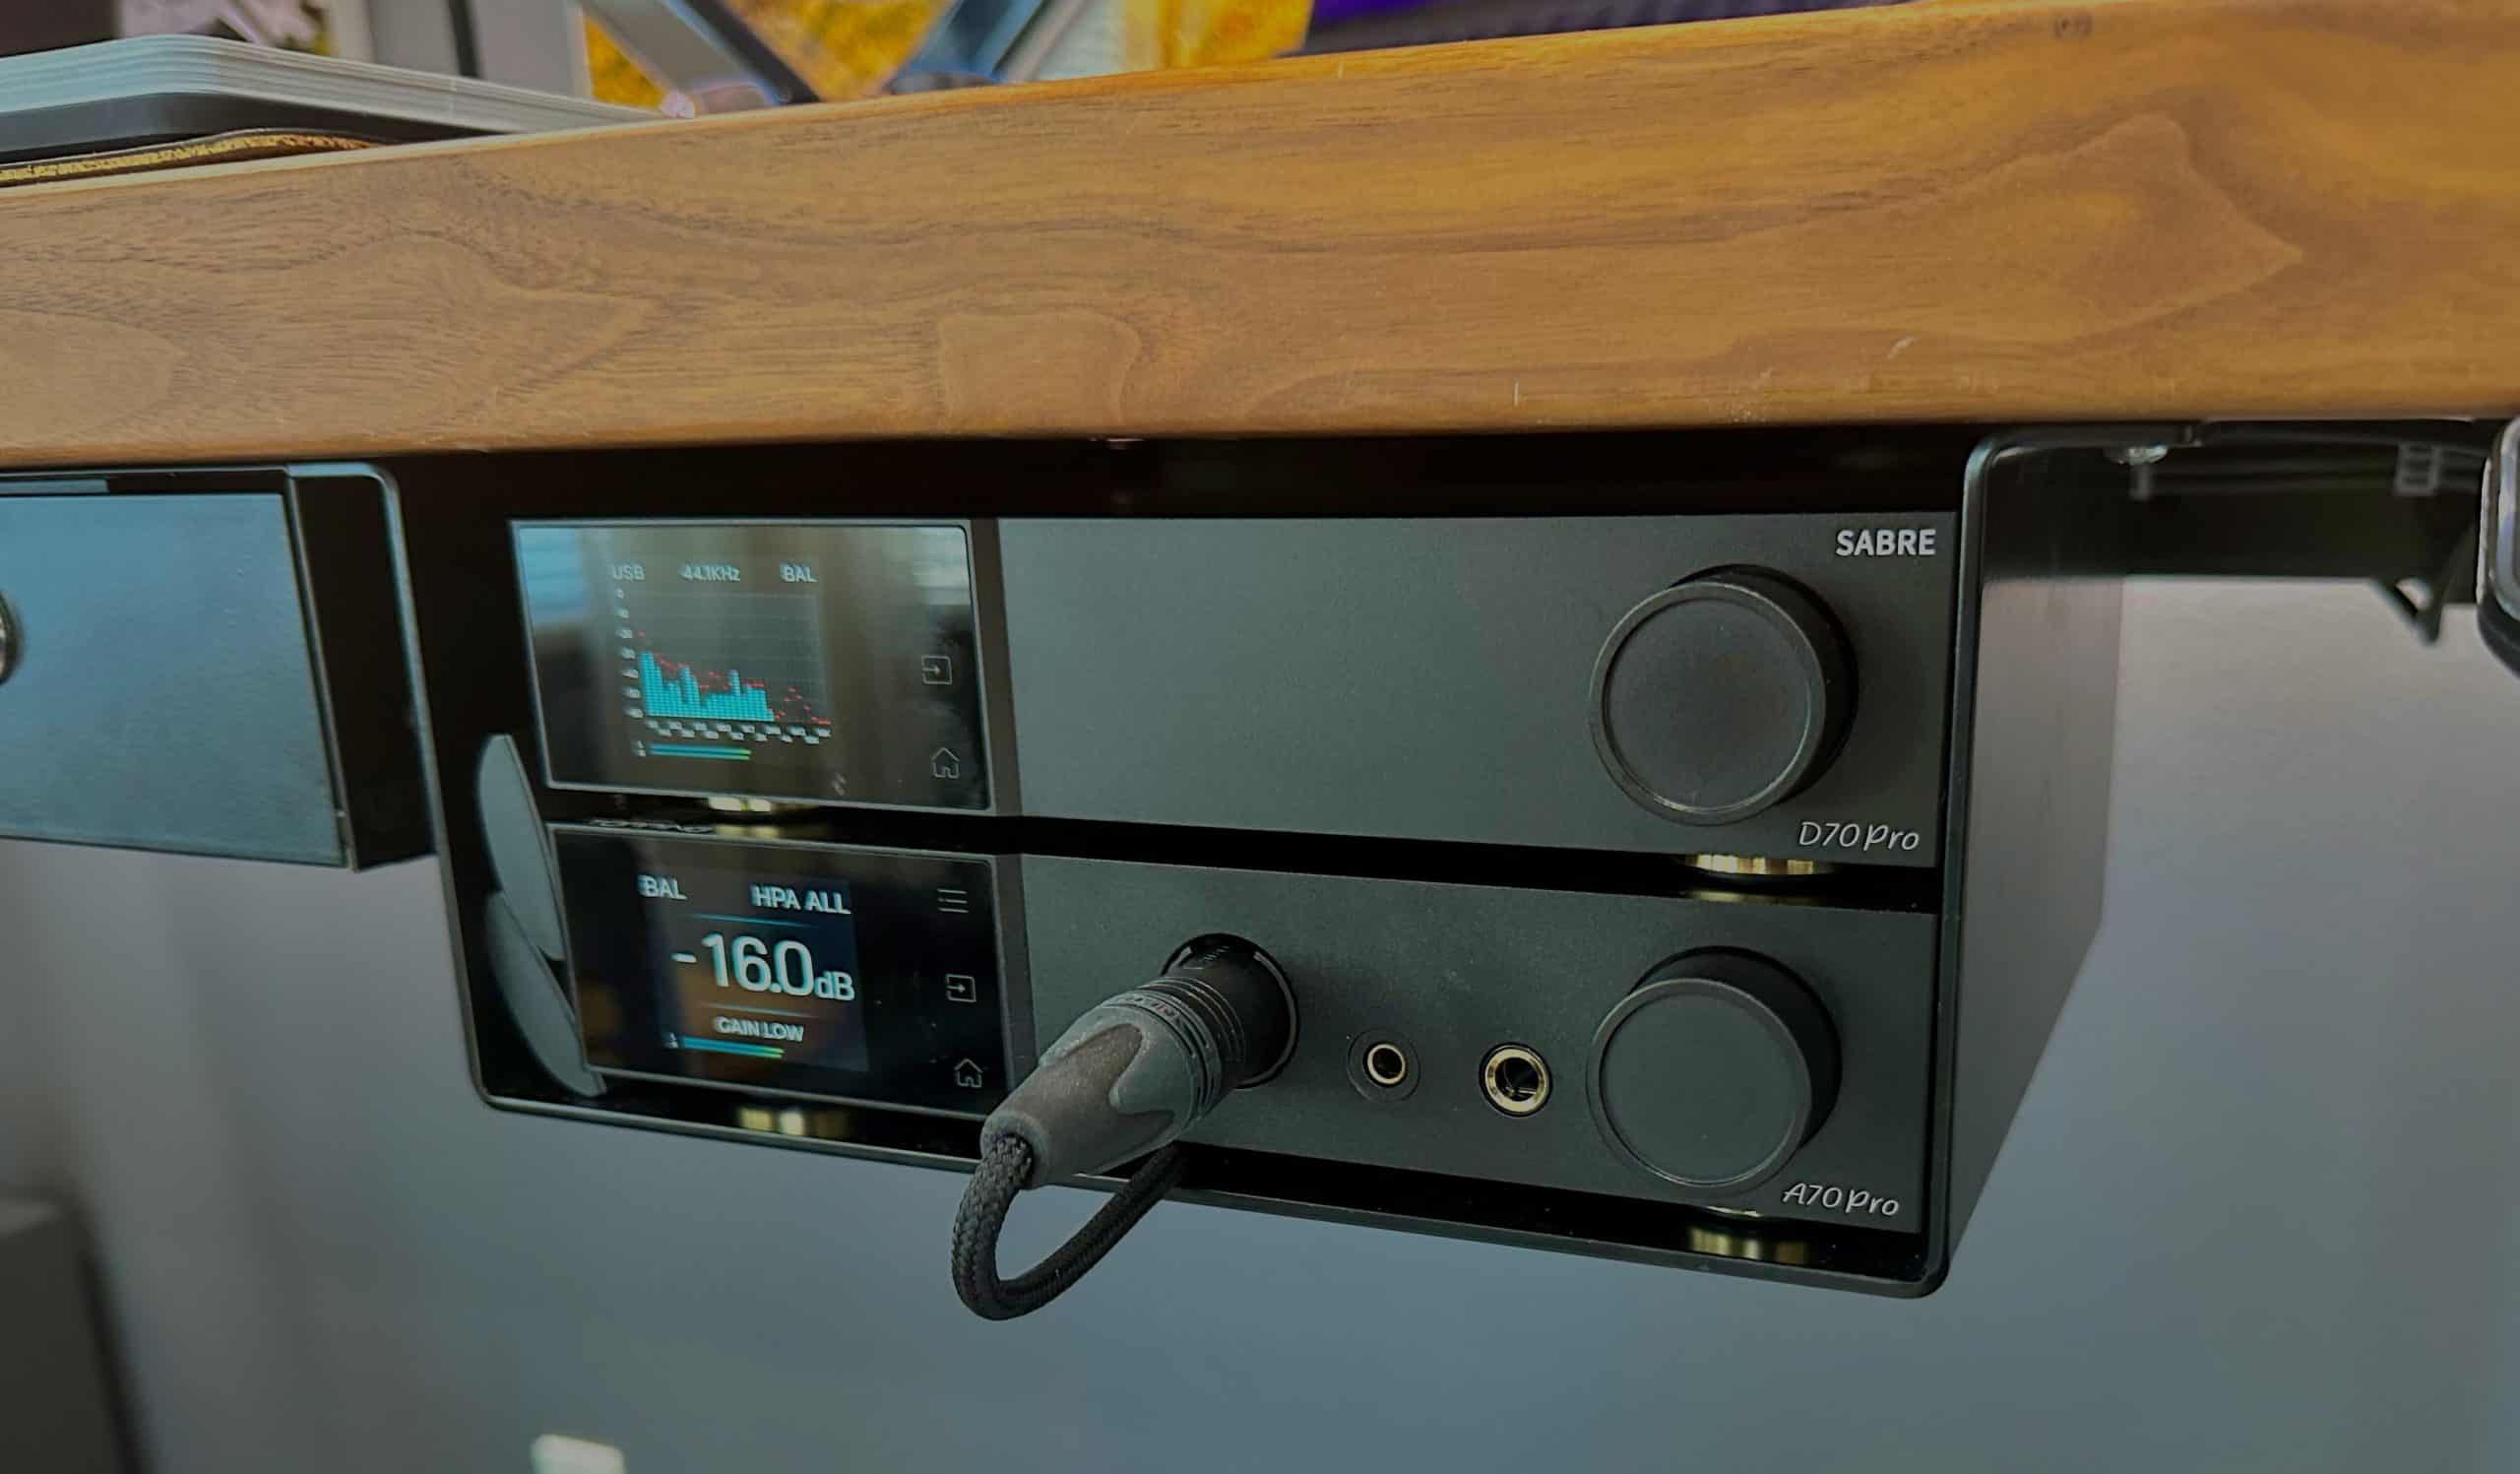
In the photo below you can see the mounting bracket for my Topping D70 Pro Sabre DAC and Topping A70 Pro headphone amp. I also made it wide enough so that the two remotes could slide in on the left side of the bracket. As a side note, the same bracket will also work for the Topping D90se/A90D DAC/Amp combo. Later in those post I’ll have dropbox links to the CAD files I used for each bracket. 

Custom Protocase Headphone DAC/Amp Mounting Bracket

By using these custom mounting brackets I can keep my desk top clean and really improve the aesthetics of my home office. So how did I create these brackets? Read on to find out how.

Protocase to the Rescue

A couple of years ago when trying to find a manufacturer for my brackets I did a lot of research. I wanted a company that didn’t charge me an arm and a leg, was fine with single quantity orders, and had free easy to use CAD software to design the brackets. 

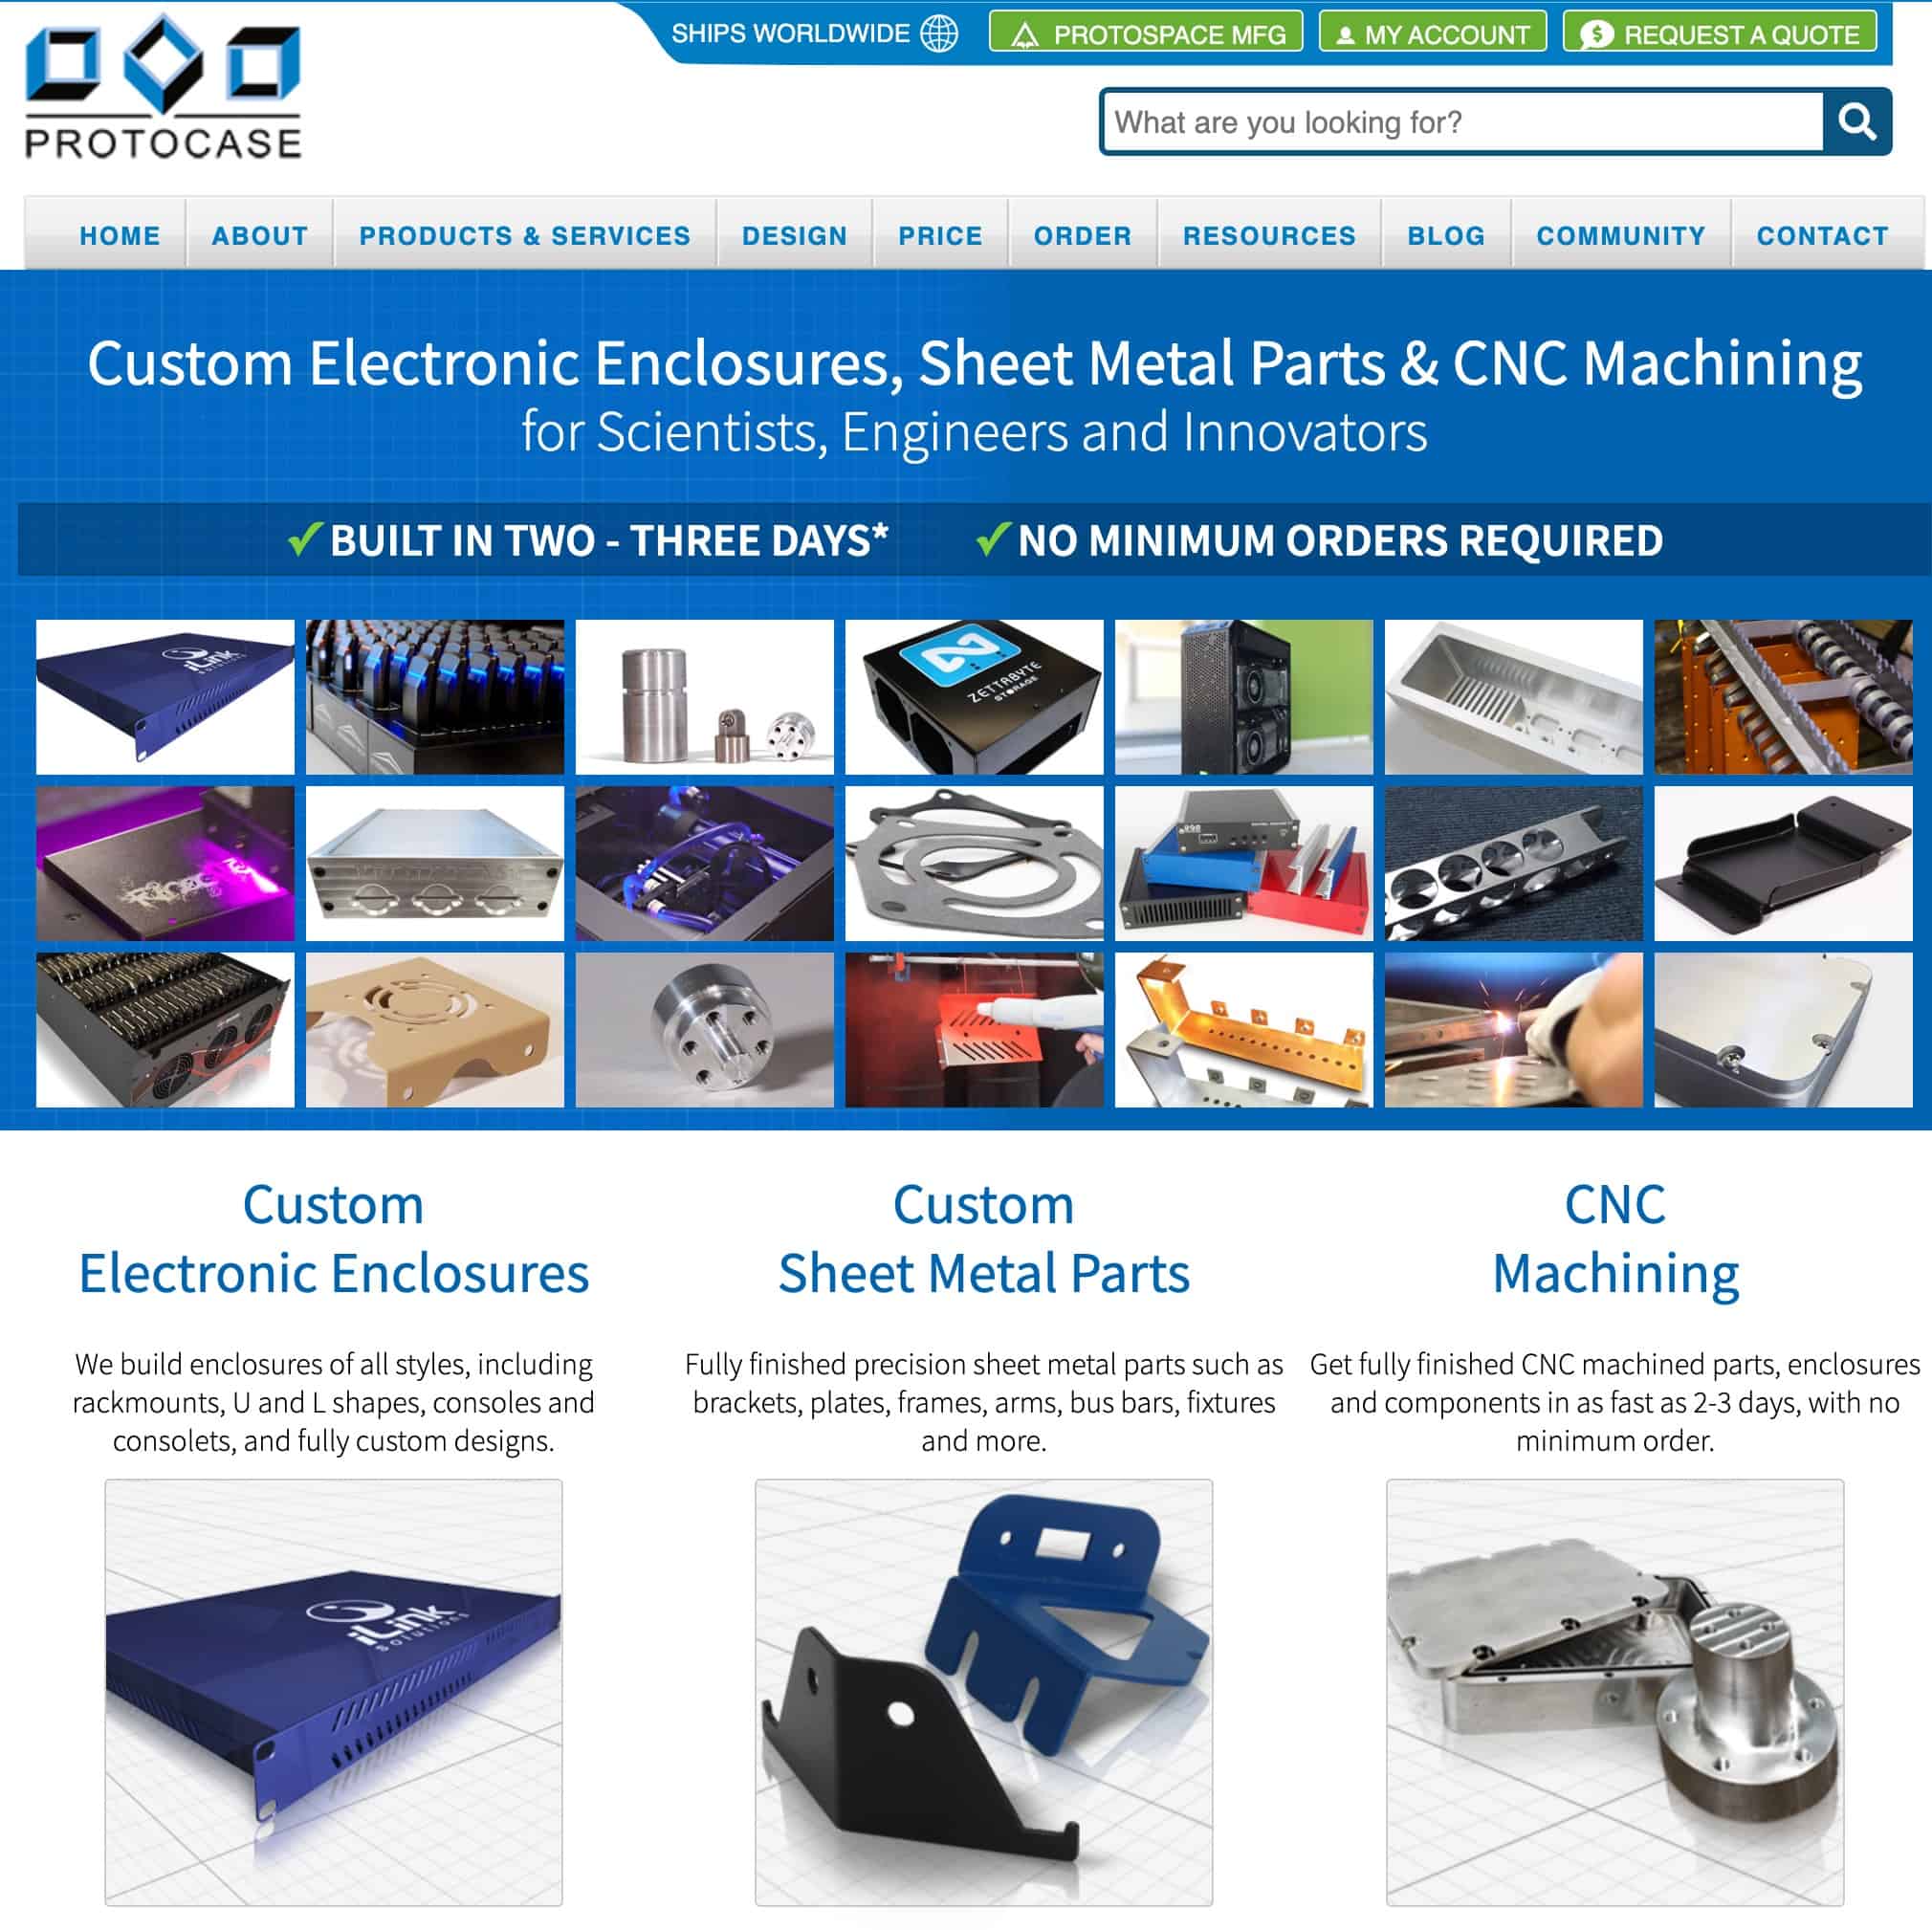
After extensive research I stumbled upon protocase.com. Their whole business model is custom enclosures for scientists, engineers, and innovators. And they can easily do single quantity orders, with a reasonable one-time setup fee per drawing. Any subsequent orders for the exact same item bypass that one time setup fee. This post will walk you through how to use the free CAD software to design an offset mounting bracket with your custom dimensions. 

Using Protocase Designer (Free)

The first thing you need to do is down the free Protocase Designer software. It’s available for Windows, Mac and Linux. The software installation process is straight forward, so I won’t walk you through that. But after it’s installed we can now start designing our offset bracket.

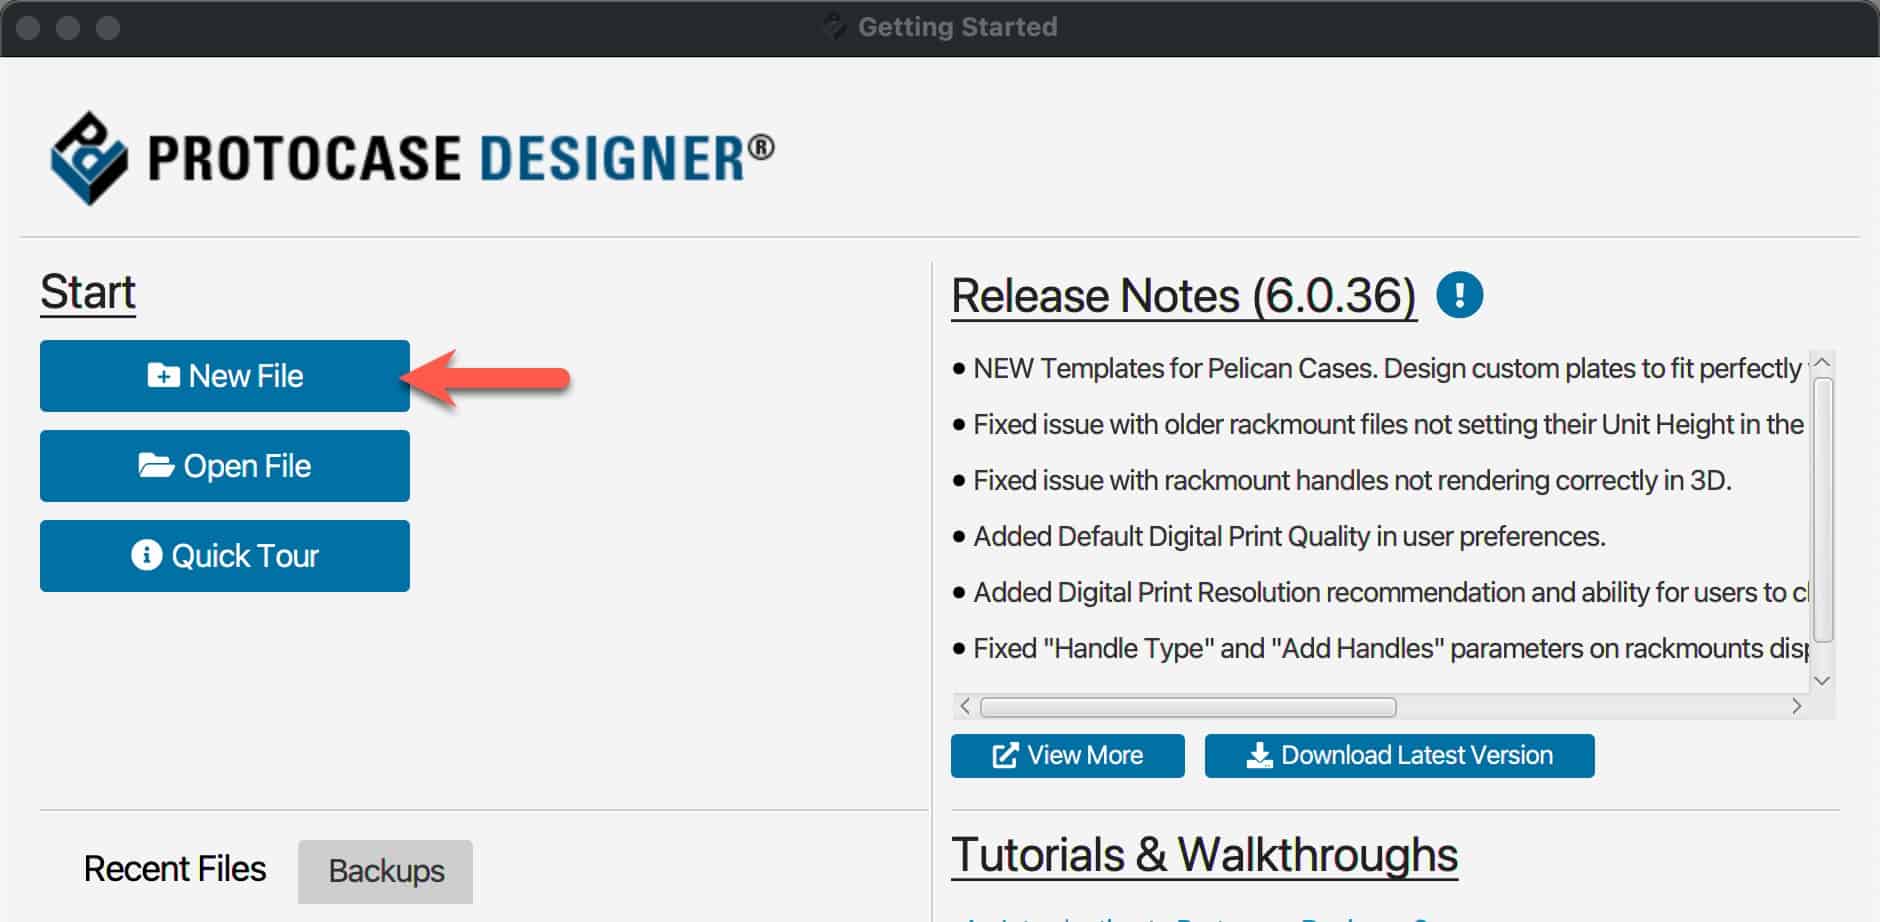
1. Launch Protocase Designer and select New File. 

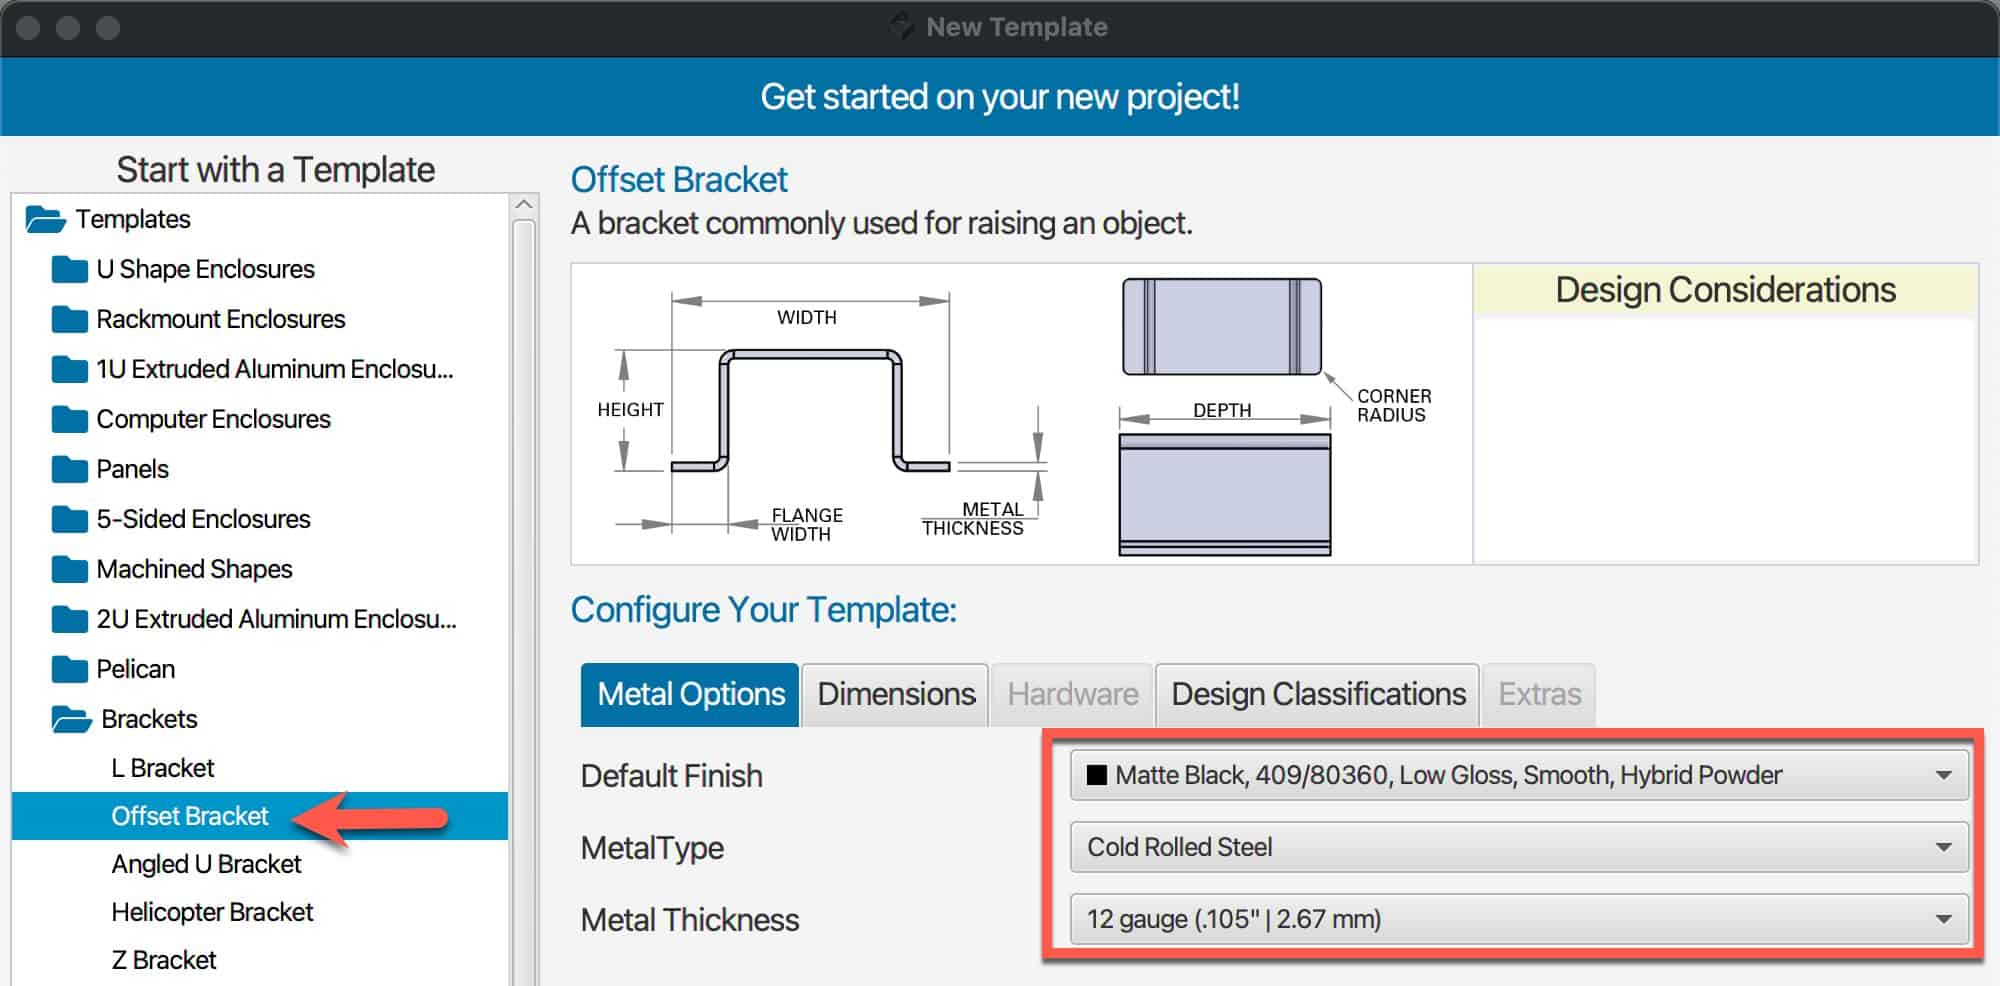
2. Under the Templates navigate to Brackets -> Offset Bracket.
3. In the middle of the window we can now select our material and finish. I love the matte black hybrid powder look. For the metal type Cold Rolled Steel is a great option. I wanted very heavy duty brackets, so I chose 12 gauge. The cost difference between the gauges is negligible. Protocase has a wide range of colors, materials, and thickness options so you can customize as you wish. But I’ve found the options I’ve shown below to work exceptionally well for my brackets. 

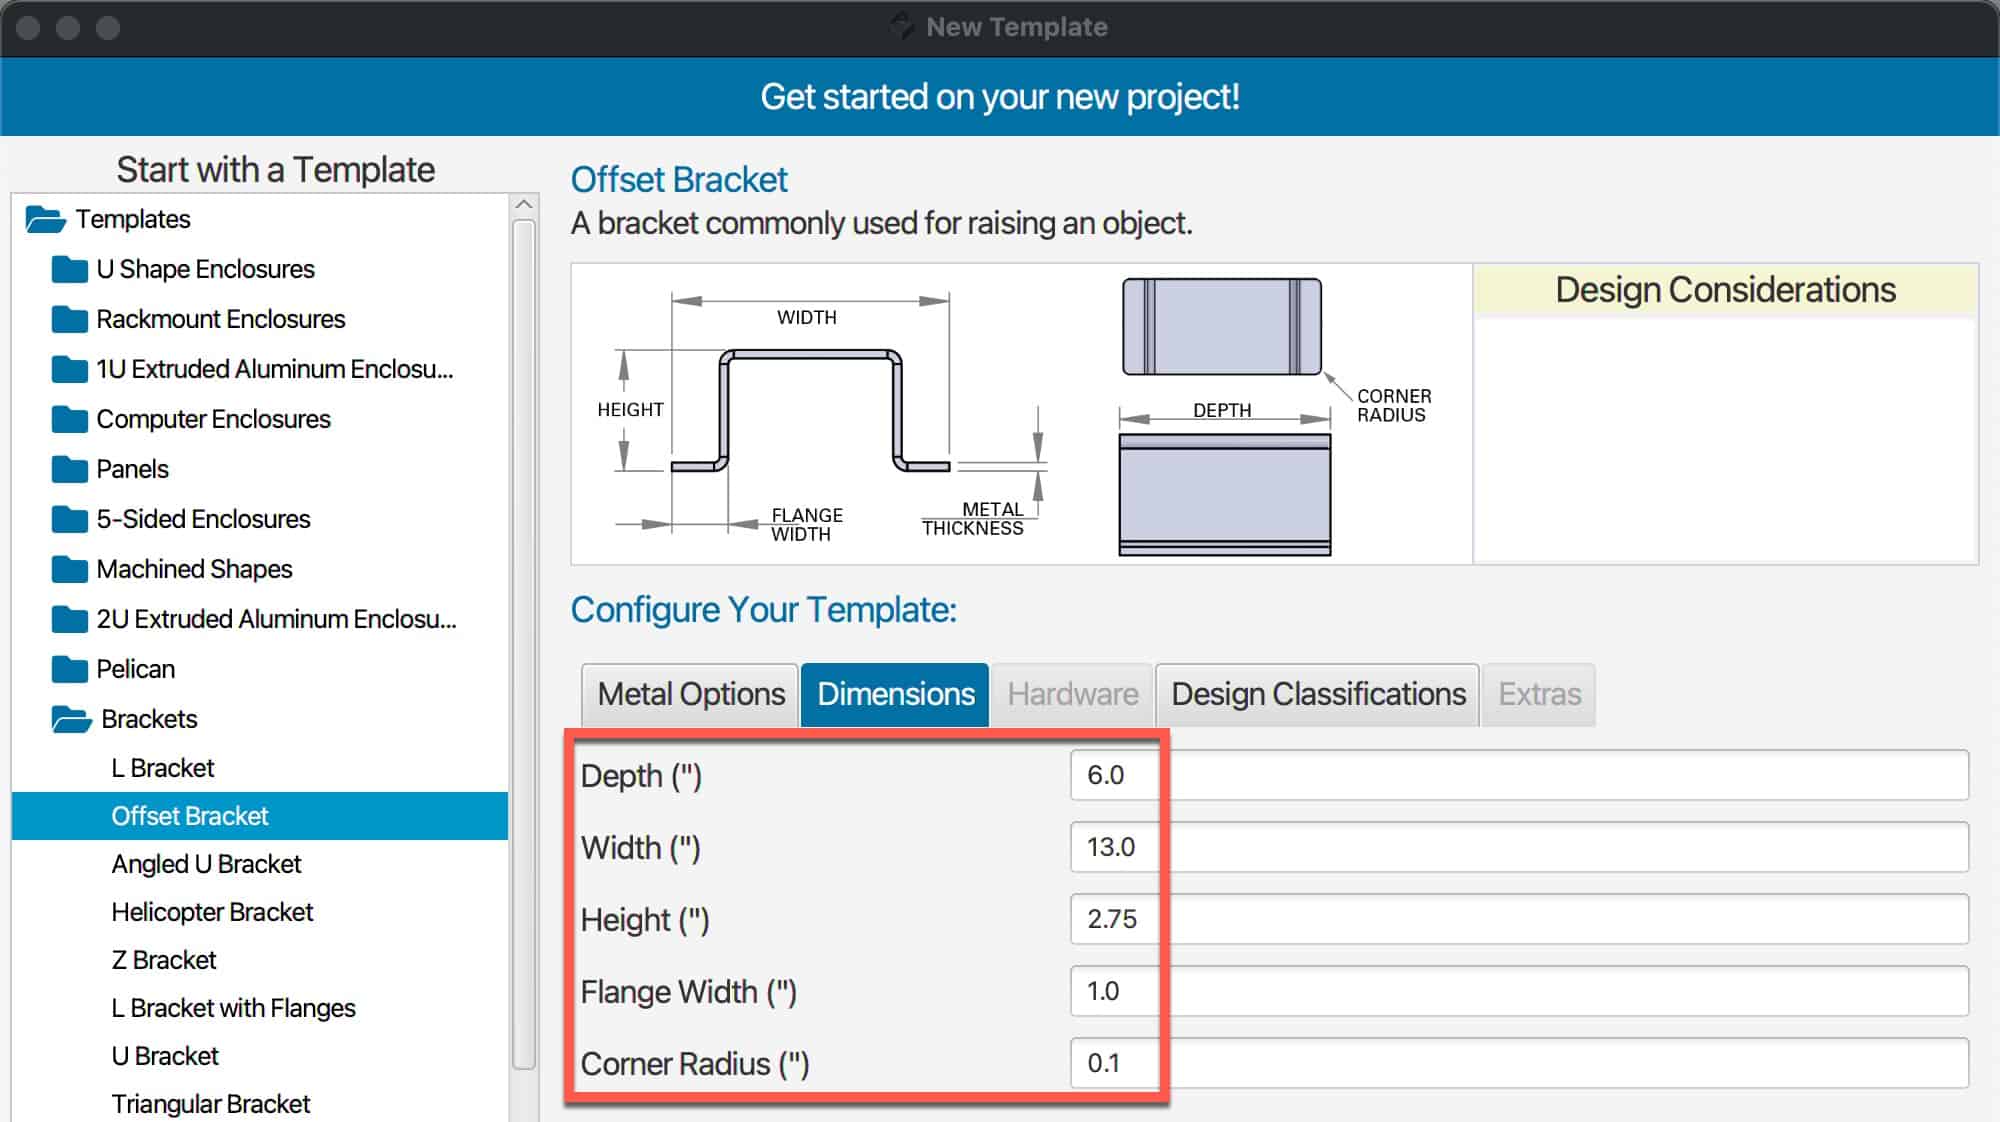
4. Click on Dimensions. Understanding how Protocase uses the dimensions you specify is key to getting the right size produced. 

  • Depth – Straight forward. This is how deep, front to back, you want your bracket. 
  • Width – This is a bit tricky. Their width INCLUDES the two mounting flanges in the dimensions. And a bit of the interior usable width it used by the material thickness (2x the material thickness you selected).  So do NOT enter just the width of your device here. 
  • Height – The height is the exterior height, which includes 2x the material thickness you picked. 
  • Flange width – This is how wide the mounting flange is that will have the screw holes. I always use one inch
  • Corner Radius – I leave this as the default .1.

Example: Let’s say you have a device that has the following dimensions: 10 inches wide, 2 inches high and 5 inches deep. For electronic devices you want some breathing room so heat can dissipate. 

If I was designing the offset bracket for that devices, here’s what I’d do:

  • Add an inch to the depth: 5″ + 1″ = 6″
  • For the width I’d calculate it: 10″ + 2x 1″ (for each flange) + 1″ extra for breathing = 13 ” (minimum, might add more)
  • Add at least .75″ to the height to account for bracket material thickness, and allow an air gap above for heat dissipation. 2″ + .75″ = 2.75″
  • Always use 1″ for the flanges

Depending on the characteristics of your device, you might want even more air space around the device. Don’t make it too tight unless you want to cook your device.  

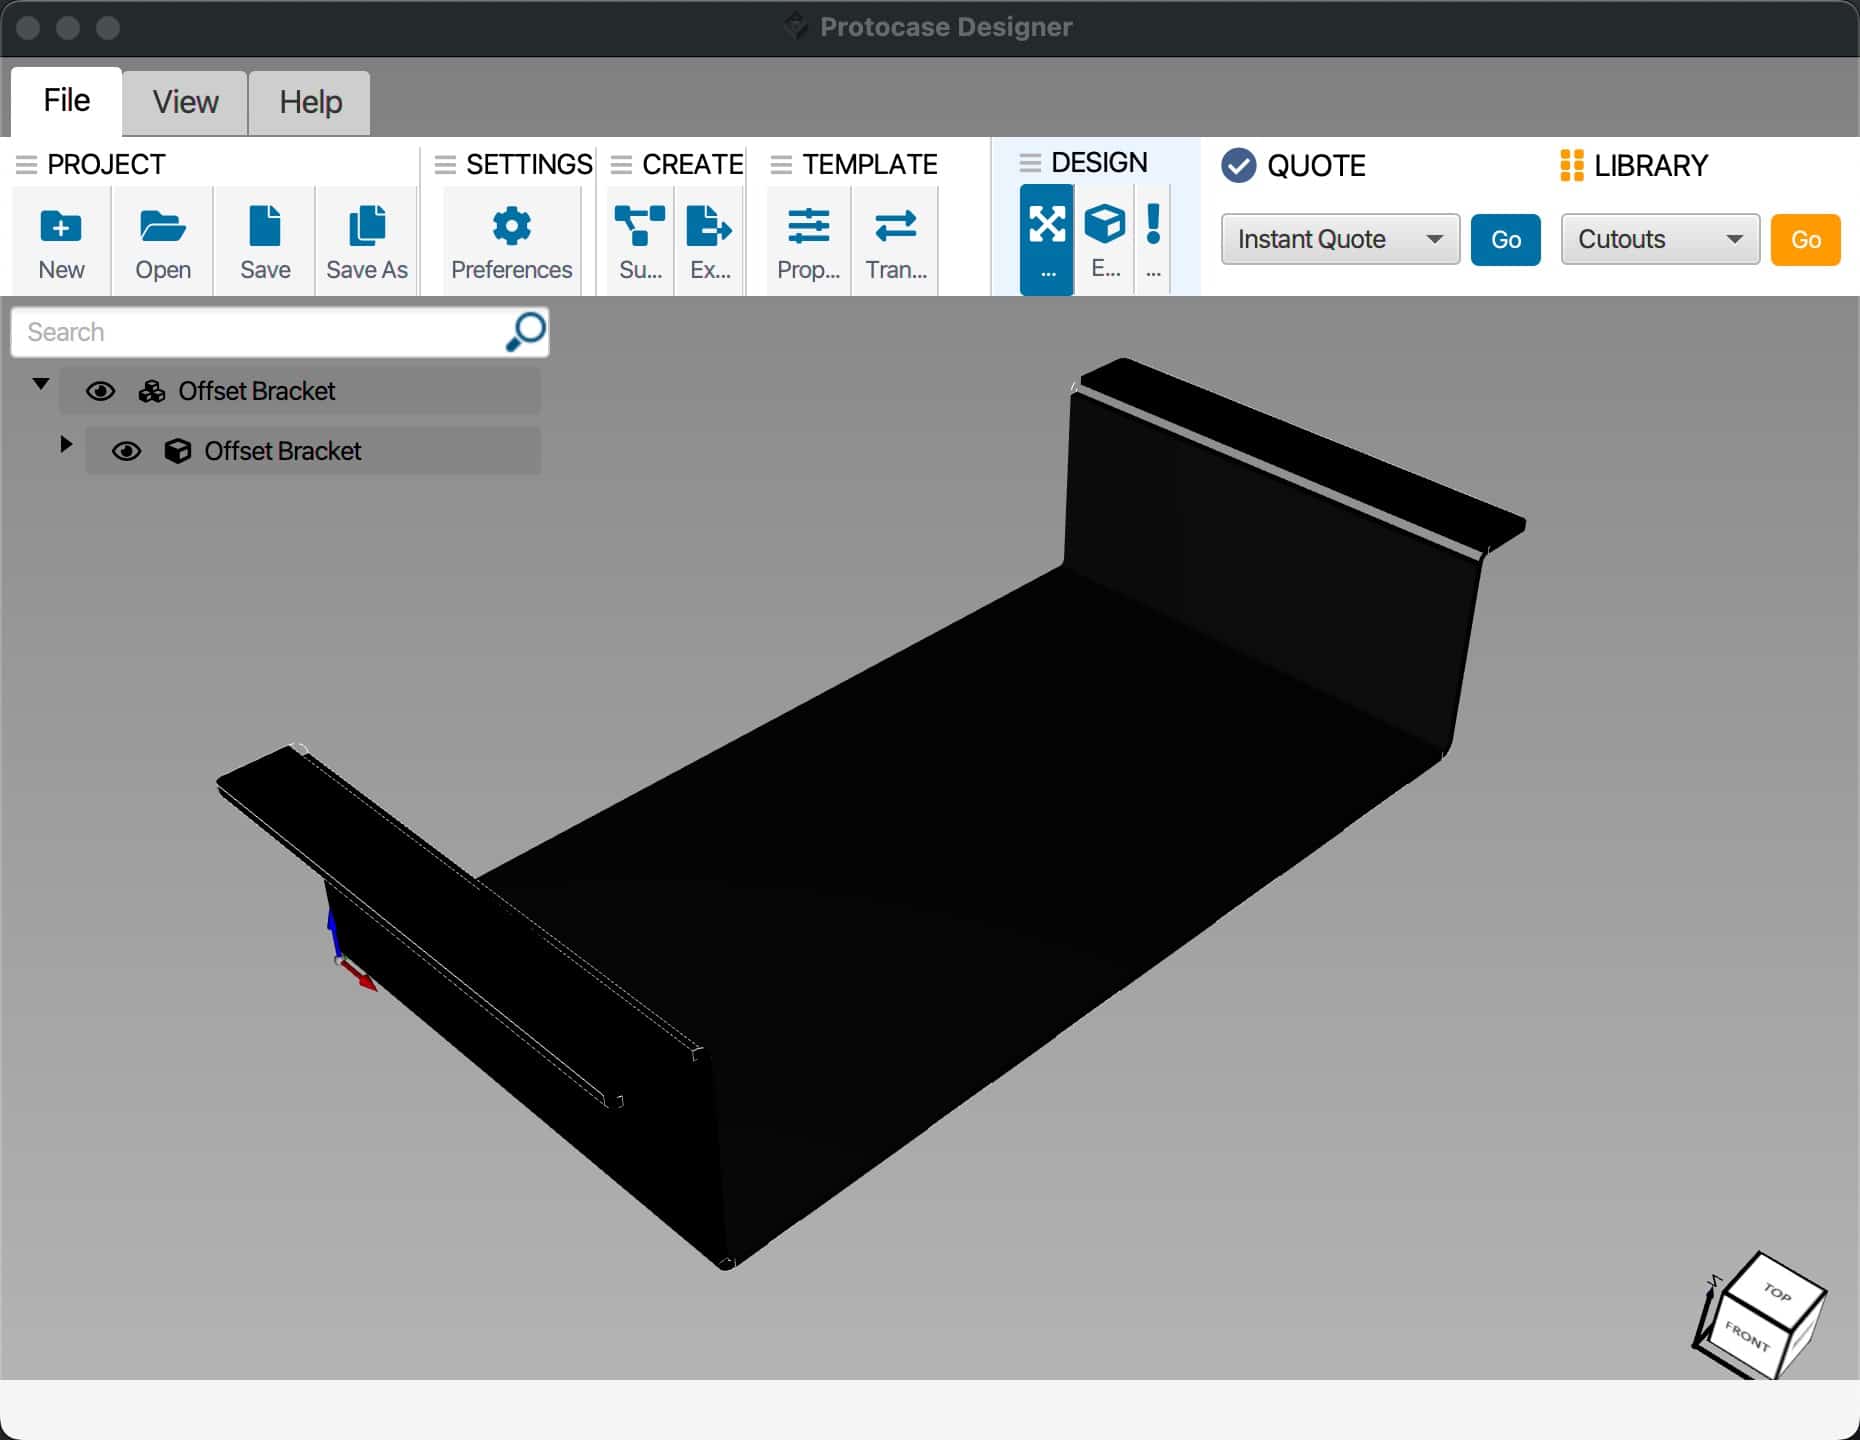
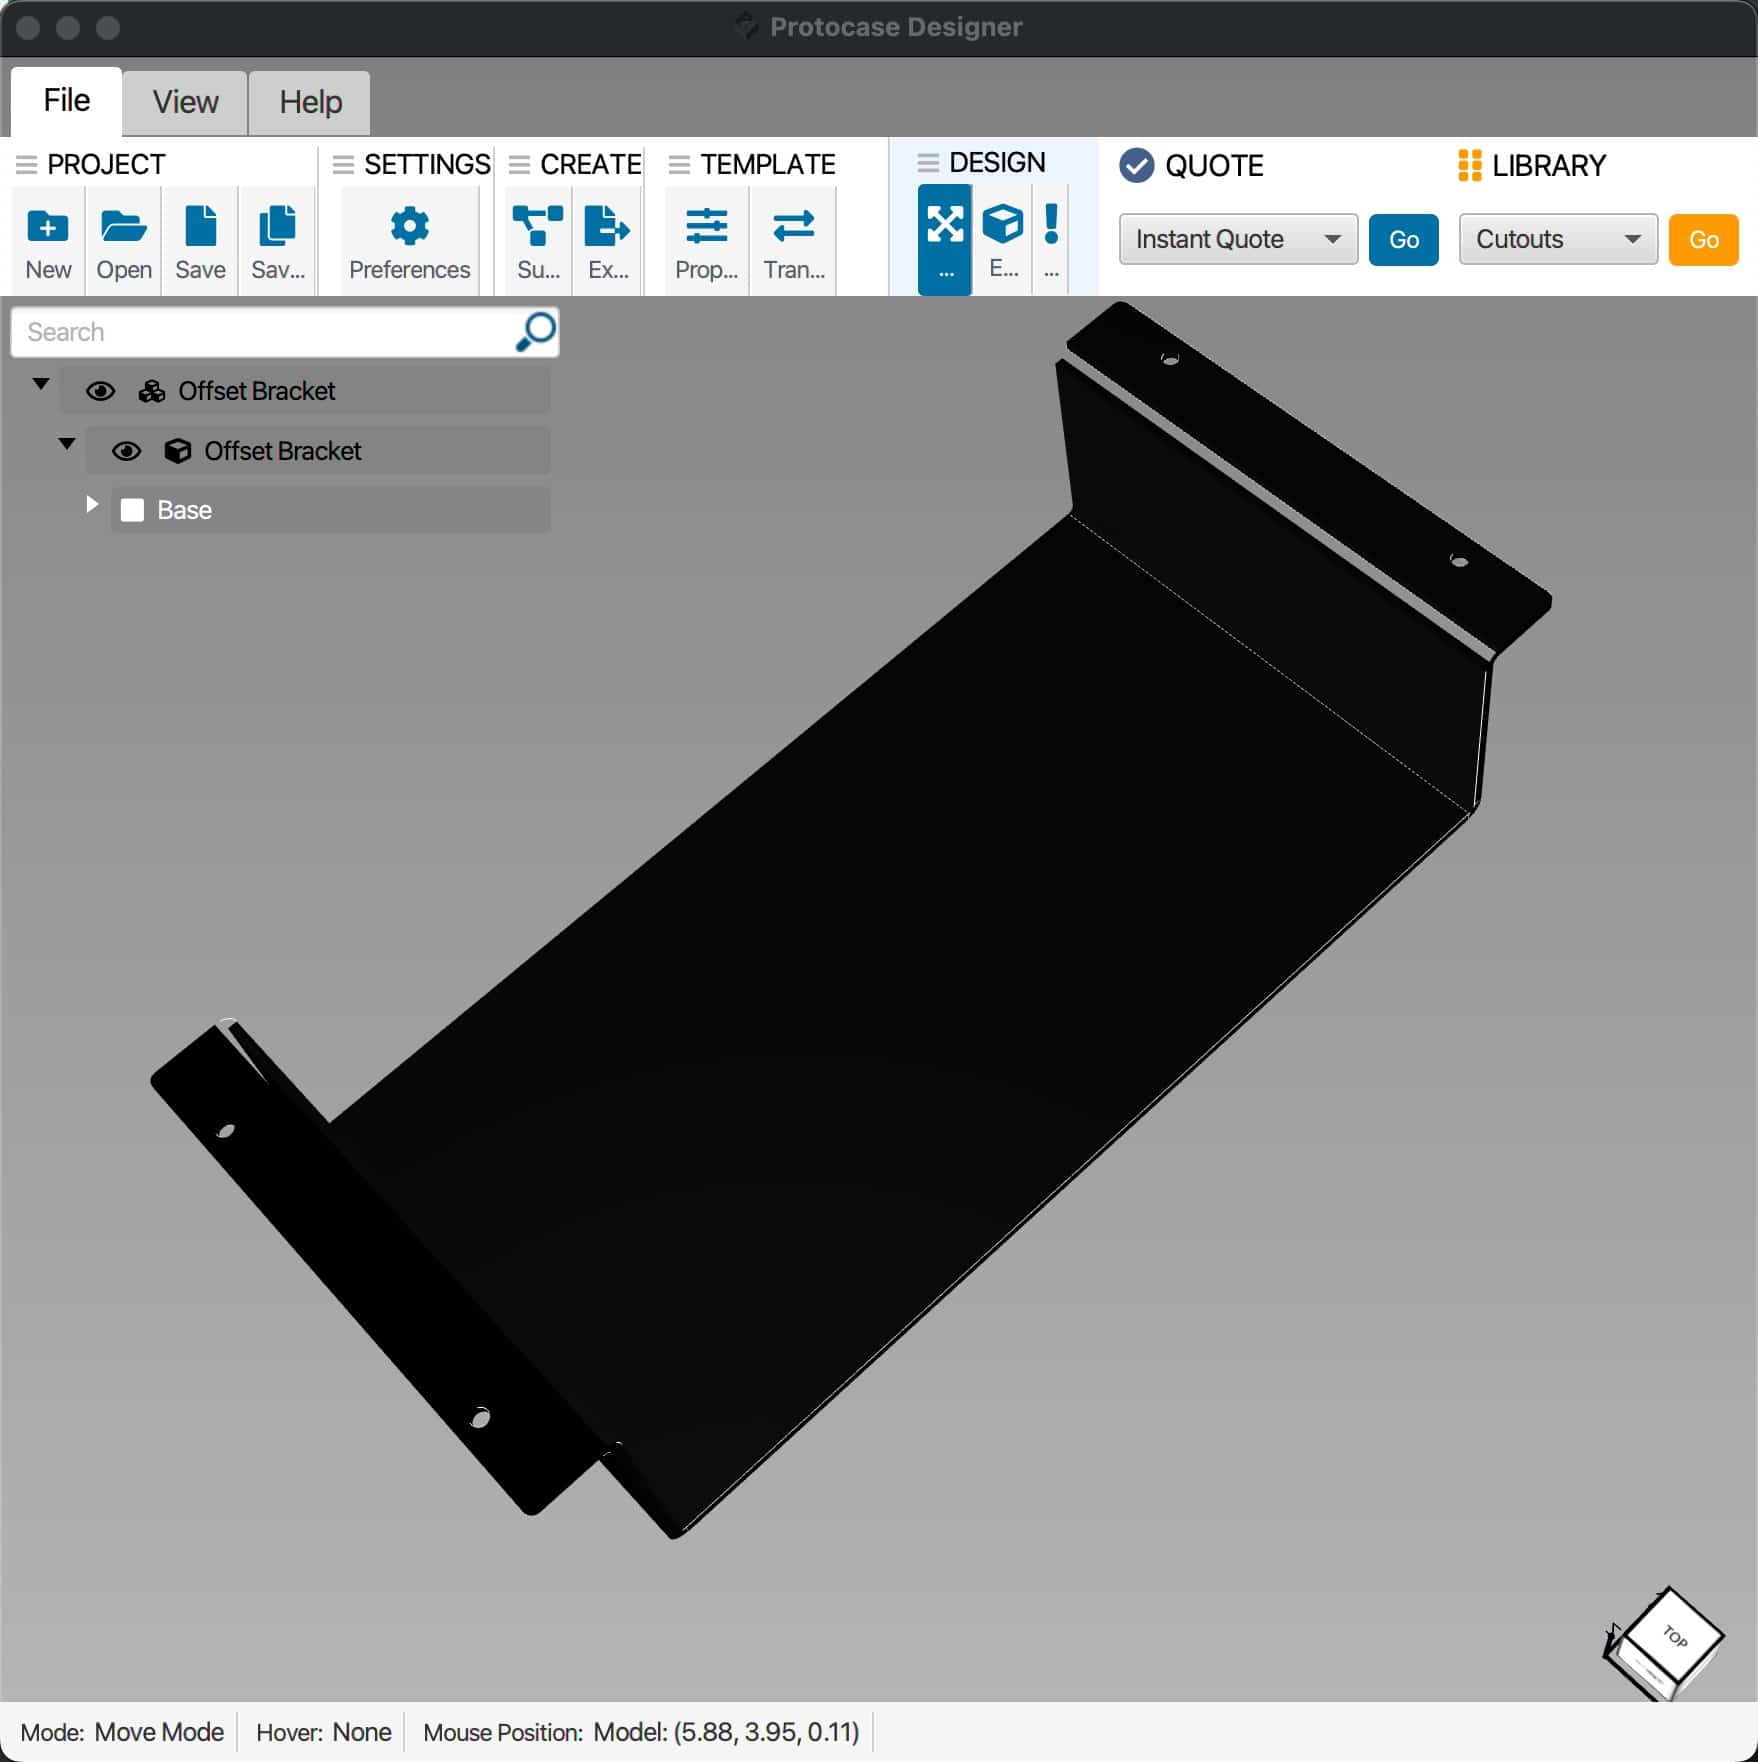
5. Click on Start Designing. You should now see a 3D representation of your bracket. The only thing we need to change is adding screw holes in both flanges. This is pretty easy. 

6. At the top of the window click on Edit Face. Click on one of the flanges. A new window should open that looks similar to the one below. The black portion of the diagram is where we want to place two mounting holes. They can’t be too close to the edge or to the body of the bracket. 

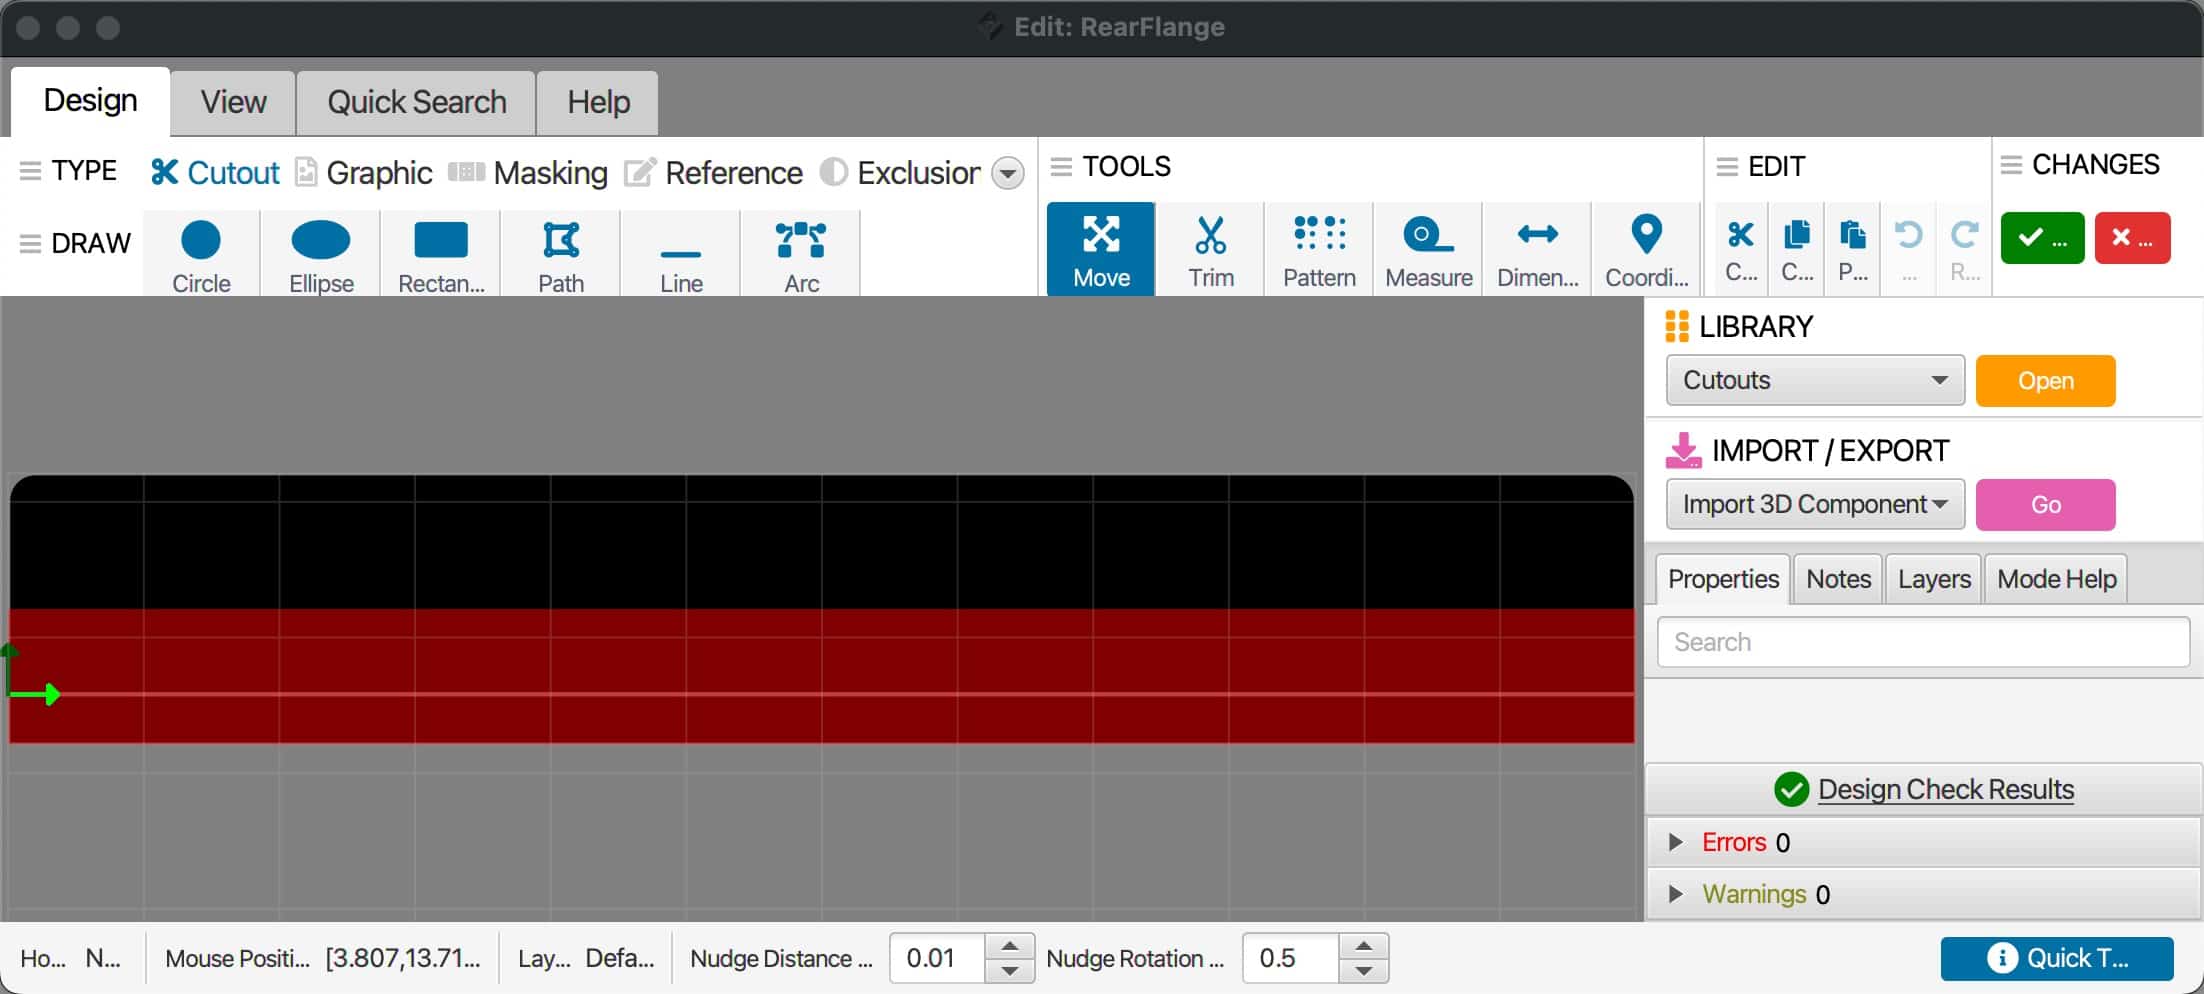
7. Click on Circle in the tool bar.
8. Click and drag slightly somewhere close to where you want the first hole. 
9. In the right pane change the diameter to .188″ (or whatever you want, but I’ve found this works well). This needs to be large enough for the type of screw you want to use. 
10. Modify the OriginX and OriginY to place the hole where you want it. I suggest at least one inch in from both ends (OriginX), and center it vertically in the black portion of the flange (OriginY). 

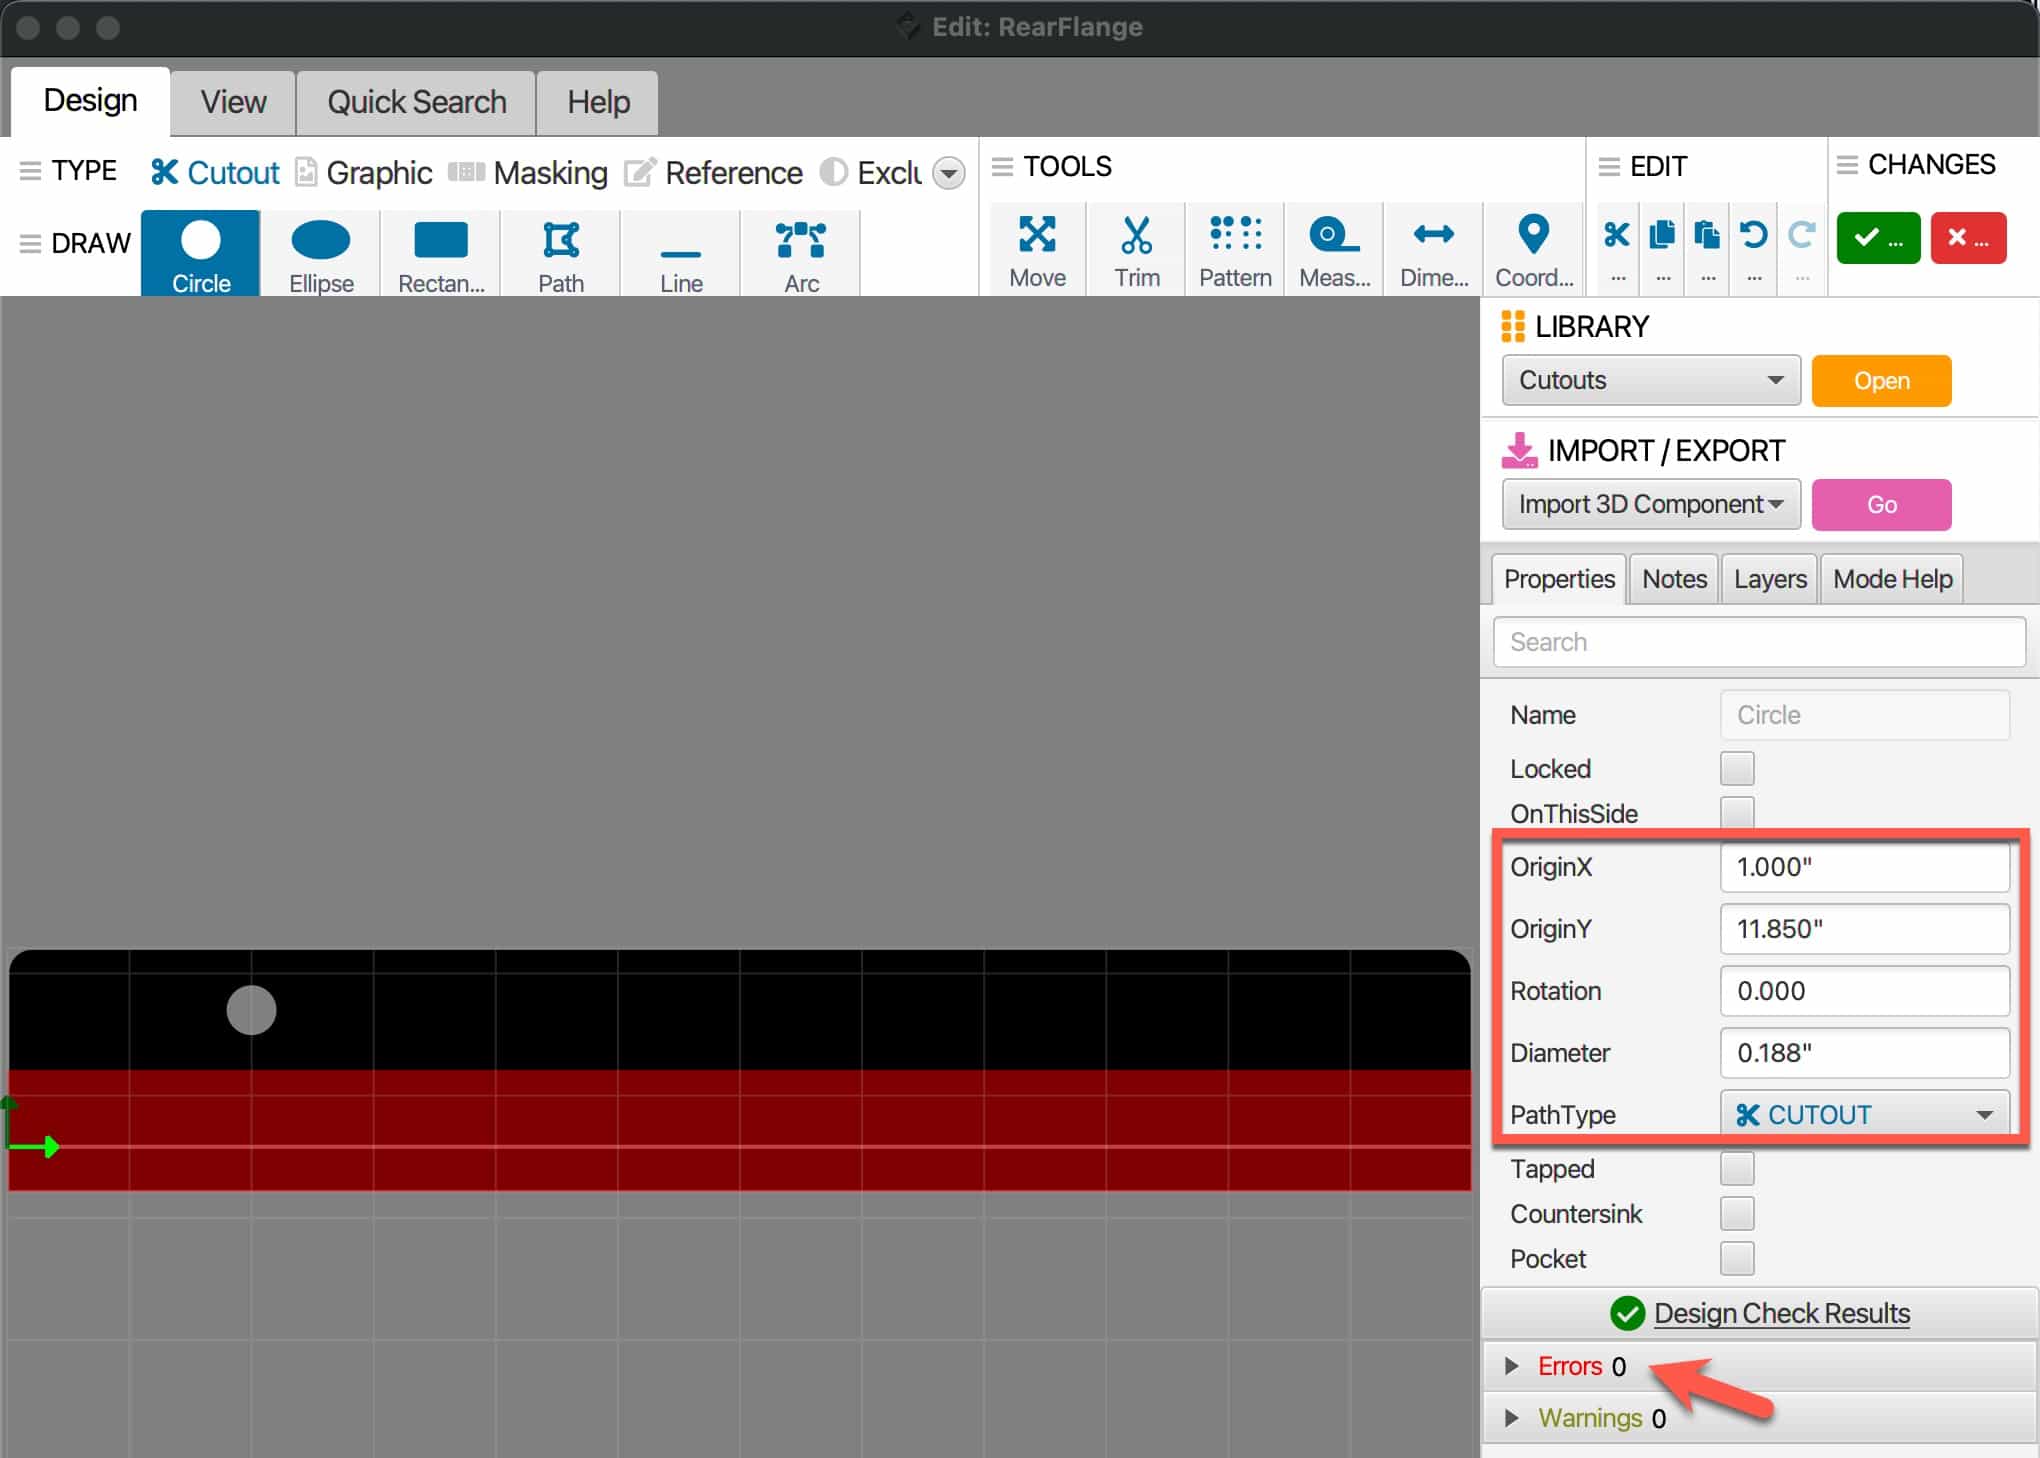
11. If your hole is too close to either edge, or it’s too small or large, you will see errors in the lower right of the window. Ensure you have NO errors. If so, adjust as needed. 
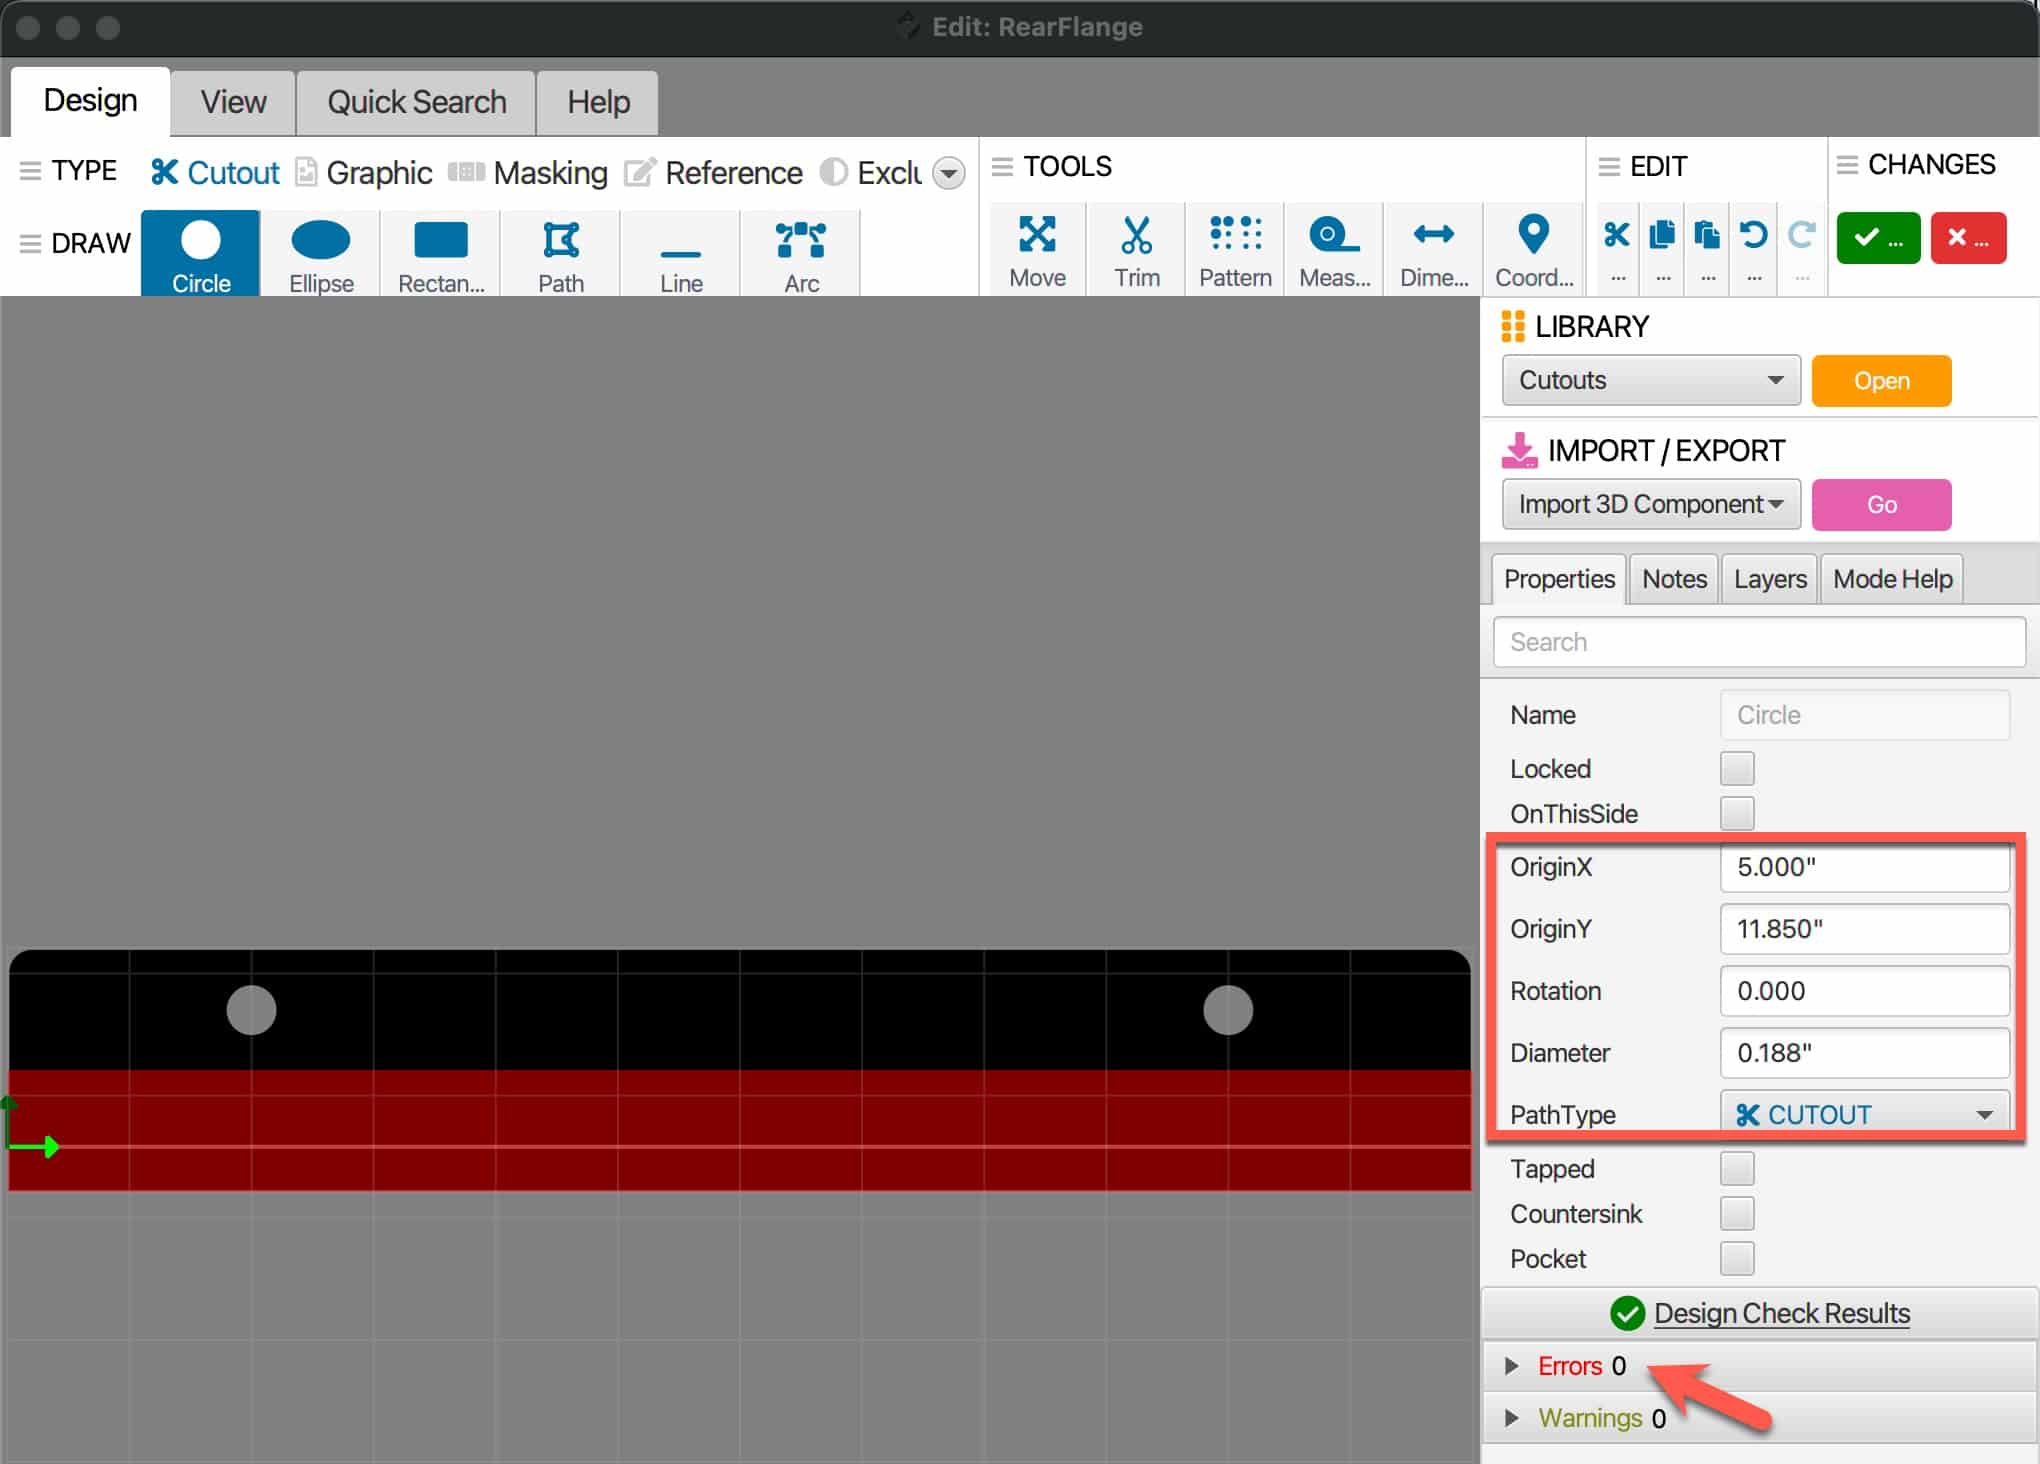
12. Repeat the Circle steps to make a second hold on the other end of the flange. I would use symmetrical dimensions so that it looks professional. In this case, this means the Diameter and OriginY are the same as the first circle. You only need to adjust the OriginX to be an inch less than the depth of the bracket (5″ in my case). Again, check for any errors.

13. Click on Save in the tool bar.
14. Repeat the same process for the other flange. The second flange should use the same OriginX and dimensions for each circle as the first flange. The OriginY will be different, but try to center the circle on the black area of the flange. 
15. Once you have added the holes in the second flange, review the bracket to make sure everything looks good. You can adjust the viewing angle of the bracket by dragging it on the screen.

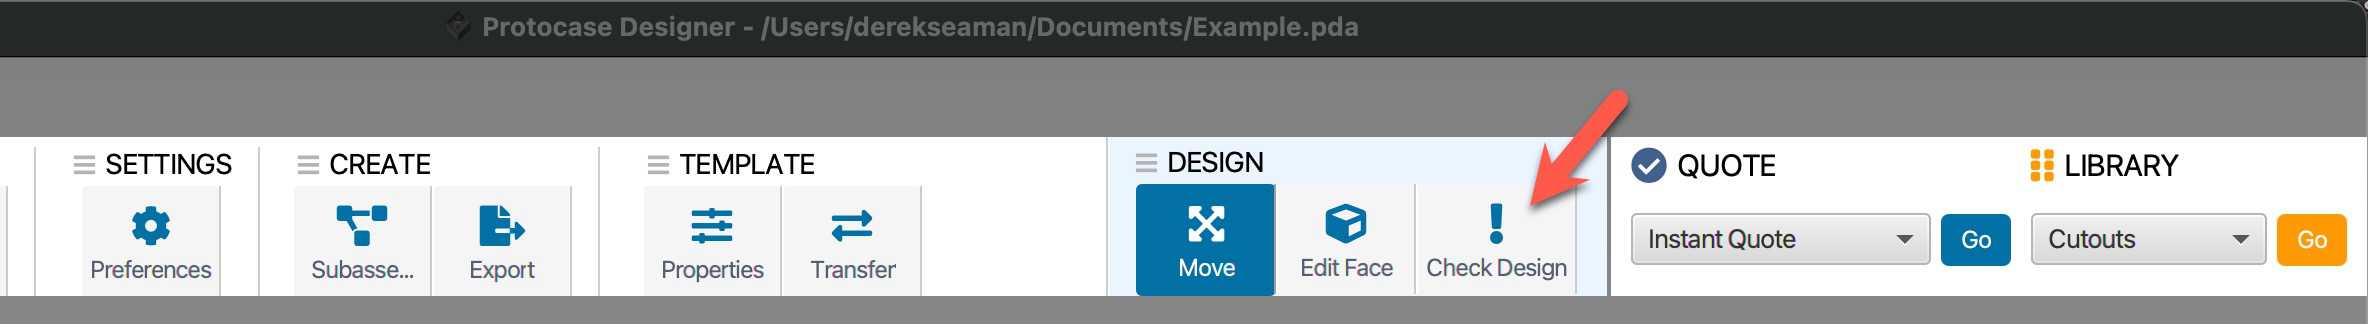
16. Now we should save the bracket, before we try to get a Quote. Click on Save in the toolbar. 
17. Just to verify there are no design issues, click on Check Design in the toolbar.

Getting a Quote

You can easily get an instant quote for your part. No humans needed. 
1. Click on this Protocase link and create an account.
2. Login to your new account.
3. Back in Protocase designer click on Go next to Instant Quote in the toolbar.
4. If for some reason the website gives you 403 forbidden, click on Go again in Protocase designer and see if it works (usually does for me).
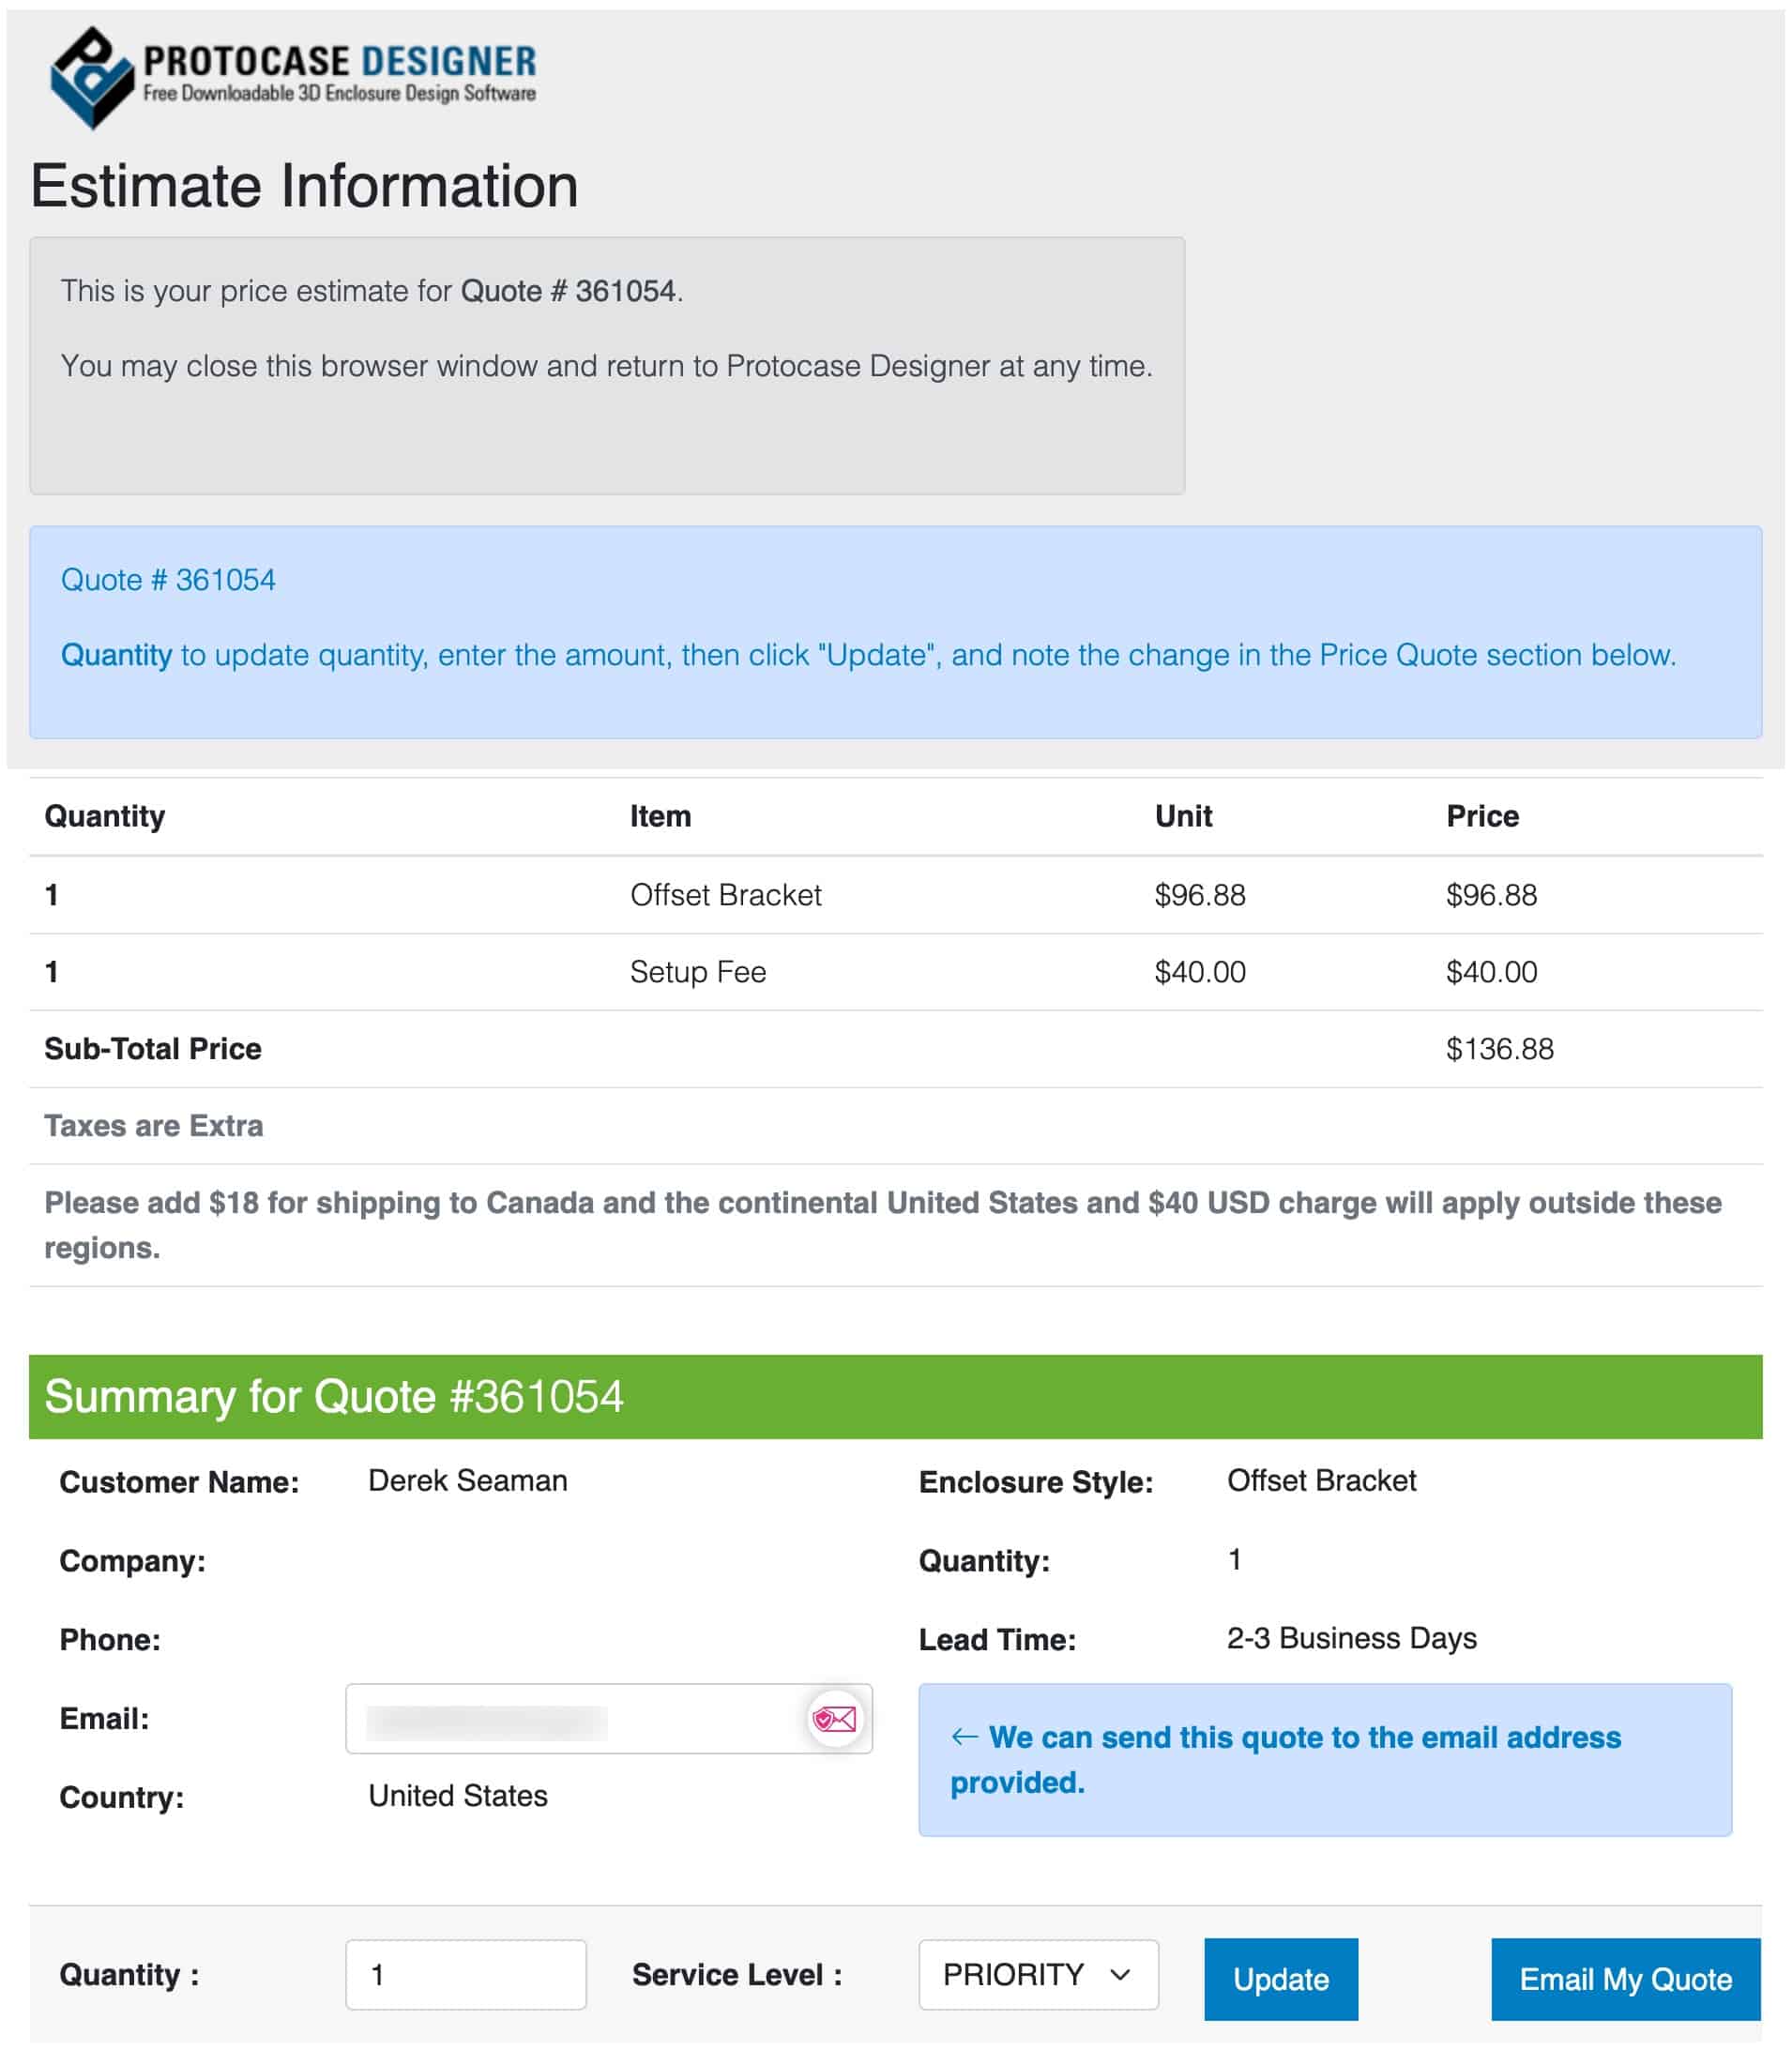
5. After a few seconds a quote should appear before your eyes. The setup Fee is a one time cost that is waived on future orders for the exact same item. You can then get an email quote.
6. If you wish to order, you can go through that process which in my experience does involve a human to generate a final invoice. But they are SUPER responsive and VERY friendly. Lead time is usually very short (2-3 business days), and they ship it in very robust packaging. 

My Custom Bracket CAD Files

If you are interested in the brackets I’ve designed I’ve put my Protocase designer CAD files on Dropbox for you to download:

Topping DAC/Amp Bracket (D90se/A90D or D70 Pro SABRE/A70 Pro)
TRENDnet 5-Port 10G Switch (TEG-S750)

Summary

Protocase is a great resource to use for your custom under desk mounting brackets. You have a wide range of materials, colors to choose from and you customize every dimension. They gladly accept orders of quantity 1 (with a one time $40 setup fee), have very short lead times, and the quality of their work is amazing. I strongly recommend them for any custom enclosures!

Read the whole story
hyourinmaru
294 days ago
reply
Share this story
Delete

Work-As-Imagined Solutioneering: Ten Traps Along the Yellow Brick Road

1 Share

This article is a reproduction of an article published in HindSight magazine issue 31 in December 2020 (all issues available at SKYbrary)

On major projects, some surprises unfold slowly via ‘work-as-imagined solutioneering’. Based on observations in several industries, Steven Shorrock presents ten traps that we can all fall into.

In the book The Wonderful Wizard of Oz, Dorothy is lost in a faraway land, and must travel the “road of yellow brick” to the Emerald City, where she will find Oz, the Great Wizard, who could help her get back to Kansas. Along the road, Dorothy is joined by three characters also in need of help from the Wizard: the Scarecrow who is in need of a brain, the Tin Woodman who is in need of a heart, and the Lion who is in need of courage. The three join Dorothy and her dog Toto on the yellow brick road, only to find their journey tormented by hazards and traps. Some of these are simply troublesome, like uneven, broken and missing bricks, and branches blocking the path. Others are deadly, including a very deep and wide ditch with “many big, jagged rocks at the bottom”, a “pack of great wolves”, a “great flock of wild crows”, a “swarm of black bees”, and “monstrous beasts with bodies like bears and heads like tigers”.

The road symbolises a path to a solution, but the road was not as imagined. And as it turned out, neither was the solution. At work, the chances are that you have come across a designed ‘solution’ that that did not solve the problem, perhaps even making your work more difficult. It could be a new computerised system, a new policy, or new performance target. Perhaps you’ve even found yourself on the yellow brick road yourself, blindsided by traps along the way.

In this article, I outline ten such traps on the yellow brick road to problematic solutions. The traps are presented in the typical sequence in which they arise in a process that I will call work-as-imagined solutioneering.

Trap 1. Complex problem situation

The process of work-as-imagined solutioneering starts with a complex problem situation. Complex problem situations occur in systems with:

  • a variety of stakeholders with conflicting goals,
  • complex interactions between stakeholders and other elements of the socio-technical system (visible and invisible, known and unknown, designed and evolved, static and dynamic),
  • multiple constraints (social, cultural, procedural, technical, temporal, economic, regulatory, legal, etc), and
  • multiple perspectives on the nature of the problem.

This is the first trap. In complex problem situations, problems tend to be interconnected to form what Russell Ackoff – one of the grandparents of modern systems thinking – called a ‘mess’: a system of problems. Solving one isn’t enough.

“Complex problem situations are hard to understand and have no obvious solutions. This is unappealing to most people.”

Trap 2. Complexity is reduced to something simple

Complex problem situations are hard to understand and have no obvious solutions. This is unappealing to most people. Understanding complex problem situations requires that we seek to understand:

  • the various expressions of, and influences on, the problem,
  • the stakeholders or people that influence the situation, and those affected,
  • the work affected,
  • the various contexts of work (e.g., physical, ambient, social, cultural, technological, economic, organisational, regulatory, legal), and
  • the history of the problem situation and system as a whole.

At least one of these forms of understanding is typically lacking (usually more than one, and sometimes all five). This is partly because getting this understanding requires trust and expertise, which are often in short supply. And it is partly because, once a problem is identified, there is a perceived urgency to do something in order to reduce anxiety.

So the critical activities needed understand complexity are often neglected, and complexity is reduced to something simple, such as ‘poor performance’, ‘non-compliance’ or ‘human error‘. The second trap has been set.

Trap 3. Someone has a ready- made solution

While there may be little understanding of the complex problem situation, solutions are at hand. Past experience, ideas from other contexts, committee- based idea-generation, or diktats from authority figures make a number of appealing ‘solutions’ available. These form the third trap. Examples include:

  • rules
  • procedures
  • checklists
  • mandatory training
  • commercial off-the-shelf products
  • ‘automation’
  • quantified performance targets andlimits
  • measures
  • reporting lines
  • performance reviews
  • incentives
  • punishments, and
  • reorganisation.

Most of these are not inherently bad. What is bad is introducing them – any of them – without a proper understanding of the context and the problem situation within that context. But the focus soon turns to the ‘solution’.

Trap 4. Compromises to reach consensus

As the solution is revealed, people at the blunt end are now at the sharp end of a difficult process of design and implementation. There is a lack of expertise in how to do this, and disagreements emerge as people start to see a number of complications.But consensus and the stability of the implementing group is critical, and this is the foundation of the fourth trap. The idea is put out for comment, usually to a limited audience. There are further insights about the problem situation and context system, but these arrive in a haphazard way, instead of througha process of understanding involving design and systems thinking. Eventually, compromises are made to achieve consensus and the ‘solution’ is specified further. Then plans are made for its realisation. The potential to resolvethe problem situation is hard to judge because neither the problem situation nor the context is properly understood.

Trap 5. The project becomes a thing unto itself

The focus now turns to realisation. The problem situation and context, which were always out of focus, are now out of view. The assets and real needs of all stakeholders were never in view, but the needs of the stakeholders who are invested in the roll-out of the solution have been met: they can now feel reassured that something is being done. The focus now switches from what to how: how can we implement this idea? Often this involves a heavy and inflexible plans, processes, structures, tools, management systems, and documentation requirements.

“At work, the chances are that you have come across a designed ‘solution’ that that did not solve the problem, perhaps even making your work more difficult.”

Trap 6. Authorities require and regulate it

As the ‘solution’ gets more attention, authorities come to believe that it is a Good Thing. Sometimes, solutions will be mandated and monitored by those with regulatory power, but detached from the context of work. Now there is no going back (except to Trap 4 and 5).

Trap 7. The solution does not resolve the problem situation

The solution is deployed, but it is not even the same as the original idea. More compromises have been made along the way, in terms of the concept, design, or implementation (or all three). An unwanted surprise emerges at this point: the problem remains (albeit in a different form)! The feedback loops from the sharp end to the blunt end, however, contain delays and distortion.

Trap 8. Unintended consequences

Not only does the solution not resolve the original problem, but it also brings new problems that were never imagined! In general terms, this might mean more demand, more pressure, more friction, more complexity, or more use of resources. Such surprises often appear in the interfaces between different stakeholders, departments, organisations, etc. The parts of the system just don’t fit. This may relate to the provision of monitoring, analysis, tools, materials, and technical support. Or it might just be that the deployed ‘solution’ cannot even function as intended, designed or implemented.

Trap 9. People adapt and game the system

At this point, operational work has to continue, somehow, despite the ‘solution’. And so it is necessary to adapt and compensate. Many work- as-imagined solutions can be worked- around (e.g., ‘gaming the system’). This is typical of measures (especially when combined with targets or limits) and processes, but we also work around clumsy technology, or indeed any of the ‘solutions’ listed under ‘Trap 3’. Have a think about how you have worked around each of them.

Trap 10. It looks like it works

The adaptation and gaming, combined with feedback lags and poor measures, give the illusion that the deployed solution is working, at least to those not well connected to the context of work-as-done. By not illuminating work-as-done, which is successfully compensating for and hiding the flaws in work-as-imagined, the illusion of successful implementation is maintained. This trap is almost invisible.

Of course, there may well be a vague sense that there are ‘teething issues’, but this is easily rationalised away. Too often, we are left with gaps between the four ‘varieties of human work’: work-as- imagined, work-as-prescribed, work-as- done, and work-as-disclosed (Shorrock, 2016). There is a lack of alignment between how people think others work, how people are supposed to work, how people say they work, and how people actually work.

By this stage, the project team that worked on the originally intended solution has probably moved on. The deployed system remains and now we must imagine a solution for both the original problem and the new problems.

“Not only does the solution not resolve the original problem, but it also brings new problems that were never imagined!”

Back to the Yellow Brick Road

In the book, which is rather different to the film, the traps are of course quite different to those above. But some are analogous. Interestingly, it is the Great Wizard who adapts and games the system (Trap 9): Dorothy’s three companions are fooled into receiving convincing counterfeits.

“Oz, left to himself, smiled to think of his success in giving the Scarecrow and the Tin Woodman and the Lion exactly what they thought they wanted. How can I help being a humbug,” he said, “when all these people make me do things that everybody knows can’t be done? It was easy to make the Scarecrow and the Lion and the Woodman happy, because they imagined I could do anything. But it will take more than imagination to carry Dorothy back to Kansas, and I’m sure I don’t know how it can be done.”

Indeed, the Wizard did not take Dorothy back to Kansas. How she got back was not how she imagined.

The story, and our experience, reminds us that top-down work-as-imagined solutioneering – like everything else – has limits. In the end, it tends not to solve the original problem and comes with unintended consequences, which are compensated for in ways that are hard to see.

So, next time you notice a ‘problematic solution’, either developing or deployed, perhaps it is worth trying to understand how it came to be. How did the ‘solution’ itself make sense during the process of its development? If work is now more difficult and less effective, the chances are that you will find a few of the traps above, which – by the way – we can all fall into. But more importantly, perhaps you can intervene to help realign work- as-imagined with work-as-done.

“Over the last few years there has been a call to enshrine ‘saying sorry’ in law. This became the ‘duty of candour’. When this was conceived it was imagined that people would find the guidance helpful and that it would make it easier for frontline staff to say sorry to patients when things have gone wrong. Patient advocates thought it would mean that patients would be more informed and more involved and that it would change the relationship from an adversarial to a partnership one. In practice this policy has created a highly bureaucratic process which has reinforced the blame culture that exists in the health service. Clinical staff are more fearful of what to say when something goes wrong and will often leave it to the official process or for someone from management to come and delivery the bad news in a clinical, dispassionate way. The simple art of talking to a patient, explaining what has happened and saying sorry has become a formalised, often written, complied duty. The relationships remain adversarial and patients do not feel any more informed or involved as before the duty came into play.”

Suzette Woodward, Patient Safety Lecturer and Former Paediatric Intensive Care Nurse

“With the installation of a fully computerised system for ordering all sorts of tests (radiology requests, lab requests, etc.) work-as-imagined (and work-as prescribed) was that this would make work more efficient and safer, with less chance of results going missing or being delayed. Prior to the installation, there was much chat with widespread talk of how effective and efficient this would be. After installation, it became apparent that the system did not fulfil the design brief and while it could order tests it could not collate and distribute the results. So work-as-done then reverted to the system that was in place before where secretaries still had to print results on bits of paper and hand them to consultants to action.”

Craig McIlhenny, Consultant Urological Surgeon

Reference

Shorrock, S. (2016, 5 December). The varieties of human work. Humanistic Systems. https://humanisticsystems. com/2016/12/05/the-varieties-of- human-work/

This article is adapted from the longer post:

Shorrock, S. (2018, 3 June). Work- as-imagined solutioneering: A 10-step guideHumanistic Systems. 


Dr Steven Shorrock is Editor-in-Chief of HindSight. He works in the EUROCONTROL Network Manager Safety Unit. He is a Chartered Psychologist and Chartered Ergonomist & Human Factors Specialist with experience in various safety-critical industries working with the front line up to CEO level. He co-edited the book Human Factors & Ergonomics in Practice and blogs at www.humanisticsystems.com


Read the whole story
hyourinmaru
410 days ago
reply
Share this story
Delete

Reykjavik Aurora

1 Share

Iceland Aurora Films have been busy filming the northern lights this winter, in rather unusual locations. This short film is all shot in the center of Reykjavik, Iceland and was extremely technically complicated to make due to the light pollution from street lights and houses. They also got really lucky with some incredibly strong Aurora displays this winter, and some Aurora shapes they had never seen before.  It’s beautiful.
Read the whole story
hyourinmaru
801 days ago
reply
Share this story
Delete

SRE, CSE, and the safety boundary

1 Share

Site reliability engineering (SRE) and cognitive systems engineering (CSE) are two fields seeking the same goal: helping to design, build, and operate complex, software-intensive systems that stay up and running. They both worry about incidents and human workload, and they both reason about systems in terms of models. But their approaches are very different, and this post is about exploring one of those differences.

Caveat: I believe that you can’t really understand a field unless you either have direct working experience, or you have observed people doing work in the field. I’m not a site reliability engineer or a cognitive systems engineer, nor have I directly observed SREs or CSEs at work. This post is an outsider’s perspective on both of these fields. But I think it holds true to the philosophies that these approaches espouse publicly. Whether it corresponds to the actual day-to-day work of SREs and CSEs, I will leave to the judgment of the folks on the ground who actually do SRE or CSE work.

A bit of background

Site reliability engineering was popularized by Google, and continues to be strongly associated with the company. Google has published three O’Reilly books, the first one in 2016. I won’t say any more about the background of SRE here, but there are many other sources (including the Google books) for those who want to know more about the background.

Cognitive systems engineering is much older, tracing its roots back to the early eighties. If SRE is, as Ben Treynor described it what happens when you ask a software engineer to design an operations function, then CSE is what happens when you ask a psychologist how to prevent nuclear meltdowns.

CSE emerged in the wake of the Three Mile Island accident of 1979, where researchers were trying to make sense of how the accident happened. Before Three Mile Island, research on "human factors" aspects of work had focused on human physiology (for example, designing airplane cockpits), but after TMI the focused expanded to include cognitive aspects of work. The two researchers most closely associated with CSE, Erik Hollnagel and David Woods, were both trained as psychology researchers: their paper Cognitive Systems Engineering: New wine in new bottles marks the birth of the field (Thai Wood covered this paper in his excellent Resilience Roundup newsletter).

CSE has been applied in many different domains, but I think it would be unknown in the "tech" community were it not for the tireless efforts of John Allspaw to popularize the results of CSE research that has been done in the past four decades.

A useful metaphor: Rasmussen’s dynamic safety model

Jens Rasmussen was a Danish safety researcher whose work remains deeply influential in CSE. In 1997 he published a paper titled Risk management in a dynamic society: a modelling problem. This paper introduced the metaphor of the safety boundary, as illustrated in the following visual model, which I’ve reproduced from this paper:

Rasmussen viewed a safety-critical system as a point that moves inside of a space enclosed by three boundaries.

At the top right is what Rasmussen called the "boundary to economic failure". If the system crosses this boundary, then the system will fail due to poor economic performance. We know that if we try to work too quickly, we sacrifice safety. But we can’t work arbitrarily slowly to increase safety, because then we won’t get anything done. Management naturally puts pressure on the system to move away from this boundary.

At the bottom right is what Rasmussen called the "boundary of unacceptable work load". Management can apply pressure on the workforce to work both safely and quickly, but increasing safety and increasing productivity both require effort on behalf of practitioners, and there are limits to the amount of work that people can do. Practitioners naturally put pressure on the system to move away from this boundary.

At the left, the diagram has two boundaries. The outer boundary is what Rasmussen called the "boundary of functionally acceptable performance", what I’ll call the safety boundary. If the system crosses this boundary, an incident happens. We can never know exactly where this boundary is. The inner boundary is labelled "resulting perceived boundary of acceptable performance". That’s where we think the boundary is, and where we try to stay away from.

SRE vs CSE in context of the dynamic safety model

I find the dynamic safety model useful because I think it illustrates the difference in focus between SRE and CSE.

SRE focuses on two questions:

  1. How do we keep the system away from the safety boundary?
  2. What do we do once we’ve crossed the boundary?

To deal with the first question, SRE thinks about issues such as how to design systems and how to introduce changes safely. The second question is the realm of incident response.

CSE, on the other hand, focuses on the following questions:

  1. How will the system behave near the system boundary?
  2. How should we take this boundary behavior into account in our design?

CSE focuses on the space near the boundary, both to learn how work is actually done, and to inform how we should design tools to better support this work. In the words of Woods and Hollnagel:

> Discovery is aided by looking at situations that are near the margins of practice and when resource saturation is threatened (attention, workload, etc.). These are the circumstances when one can see how the system stretches to accommodate new demands, and the sources of resilience that usually bridge gaps. – Joint Cognitive Systems: Patterns in Cognitive Systems Engineering, p37

Fascinatingly, CSE has also identified common patterns of system behavior at the boundary that holds across multiple domains. But that will have to wait for a different post.

Reading more about CSE

I’m still a novice in the field of cognitive systems engineering. I’m actually using these posts to help learn through explaining the concepts to others.

The source I’ve found most useful so far is the book Joint Cognitive Systems: Patterns in Cognitive Systems Engineering , which is referenced in this post. If you prefer videos, Cook’s Lectures on the study of cognitive work is excellent.

I’ve also started a CSE reading list.


Read the whole story
hyourinmaru
1414 days ago
reply
Share this story
Delete

The forbidden zone, Alex Strohl

1 Comment

The forbidden zone, Alex Strohl

Read the whole story
hyourinmaru
1454 days ago
reply
Iceland
Share this story
Delete

Display New Daily Cases of COVID-19 with Care

1 Share

Statistics are playing a major role during the COVID-19 pandemic. The ways that we collect, analyze, and report them, greatly influences the degree to which they inform a meaningful response. An article in the Investor’s Business Daily titled “Dow Jones Futures Jump As Virus Cases Slow; Why This Stock Market Rally Is More Dangerous Than The Coronavirus Market Crash” (April 6, 2020, by Ed Carson) brought this concern to mind when I read the following table of numbers and the accompanying commentary:

U.S. coronavirus cases jumped 25,316 on Sunday [April 5th] to 336,673, with new cases declining from Saturday’s record 34,196. It was the first drop since March 21.

The purpose of the Investor’s Business Daily article was to examine how the pandemic was affecting the stock market. After the decline in the number of reported new COVID-19 cases on Sunday, April 5th, on Monday, April 6, 2020, the stock market surged (Dow Jones gained 1,627.46 points, or 7.73%). This was perhaps a response to hope that the pandemic was easing. This brings a question to mind. Can we trust this apparent decline as a sign that the pandemic has turned the corner in the United States? I wish we could, but we dare not, for several reasons. The purpose of this blog post is not to critique the news article and certainly not to point out the inappropriateness of this data’s effects on the stock market, but merely to argue that we should not read too much into the daily ups and downs of newly reported COVID-19 case counts.

How accurate should we consider daily new case counts based on the date when those counts are recorded? Not at all accurate and of limited relevance. I’ll explain, but first let me show you the data displayed graphically. Because the article did not identify its data source, I chose to base the graph below on official CDC data, so the numbers are a little different. I also chose to begin the period with March 1st rather than 2nd, which seems more natural.

What feature most catches your eye? For most of us, I suspect, it is the steep increase in new cases on April 3rd, followed by a seemingly significant decline on April 4th and 5th.

A seemingly significant rise or fall in new cases on any single day, however, is not a clear sign that something significant has occurred. Most day-to-day volatility in reported new case counts is noise—it’s influenced by several factors other than actual new infections that developed. There is a great deal of difference between the actual number of new infections and the number of new infections that were reported as well as a significant difference between the date on which infections began and the date on which they were reported. We currently have no means to count the number of infections that occurred, and even if we tested everyone for the virus’s antibodies at some point, we would still have no way of knowing the date on which those infections began. Reported new COVID-19 cases is a proxy for the measure that concerns us.

Given the fact that reported new cases is probably the best proxy that’s currently available to us, we could remove much of the noise related to the specific date on which infections began by expressing new case counts as a moving average. A moving average would provide us with a better overview of the pandemic’s trajectory. Here’s the same data as above, this time expressed as a 5-day moving average. With a 5-day moving average the new case count for any particular day is averaged along with the four preceding days (i.e., five-days-worth of new case counts are averaged together), which smooths away most of the daily volatility.

While it still looks as if the new case count is beginning to increase at a lesser rate near the end of this period, this trend no longer appears as dramatic.

Daily volatility in reported new case counts is caused by many factors. We know that the number of new cases that are reported on any particular day do not accurately reflect the number of new infections. It’s likely that most people who have been infected have never been tested. Two prominent reasons for this are 1) the fact that most cases are mild to moderate and therefore never involve the medical intervention, and 2) the fact that many people who would like to be tested cannot because tests are still not readily available. Of those who are tested and found to have the virus, not all of those cases are recorded or, if recorded, are forwarded to an official national database. And finally, of those new cases that are recorded and do make it into an official national data base, the dates on which they are recorded are not the dates on which the infections actually occurred. Several factors determine the specific day on which cases are recorded, including the following:

  1. When the patient chooses or is able to visit a medical facility.
  2. The availability of medical staff to collect the sample. Staff might not be available on particular days.
  3. The availability of lab staff to perform the test. The sample might sit in a queue for days.
  4. The speed at which the test can be completed. Some tests can be completed in a single day and some take several days.
  5. When medical staff has the time to record the case.
  6. When medical staff gets around to forwarding the new case record to an official national database.

There’s a lot that must come together for a new case to be counted and to be counted on a particular day. As the pandemic continues, this challenge will likely increase because, as medical professionals become increasingly overtaxed, both delays in testing and errors in reporting the results will no doubt increase to a corresponding degree.

Now, back to my warning that we shouldn’t read too much into daily case counts as events are unfolding. Here’s the same daily values as before with one additional day, April 6th, included at the end.

Now what catches your eye. It’s different, isn’t it? As it turns out, by waiting one day we can see that reported new cases did not peek on April 3rd followed by a clear turnaround. New cases are still on the rise. Here’s the same data expressed as a 5-day moving average:

The trajectory is still heading upwards at the end of this period. We can all hope that expert projections that the curve will flatten out in the next few days will come to pass, but we should not draw that conclusion from the newly reported case count for any particular day. The statistical models that we’re using are just educated guesses based on approximate data. The true trajectory of this pandemic will only be known in retrospect, if ever, not in advance. Patience in interpreting the data will be rewarded with greater understanding, and ultimately, that will serve our needs better than hasty conclusions.

Read the whole story
hyourinmaru
1456 days ago
reply
Share this story
Delete
Next Page of Stories